Background
Biennales are crucial to architectural discourse, acting as platforms for debate, critique, and global
exposure. Yet the ways in which ideas evolve within their complex ecologies are often overlooked and
excluded from dominant narratives. This paradox highlights the challenge of understanding Biennales from a
twofold perspective: as both cultural phenomena and a set of relational networks. The installation
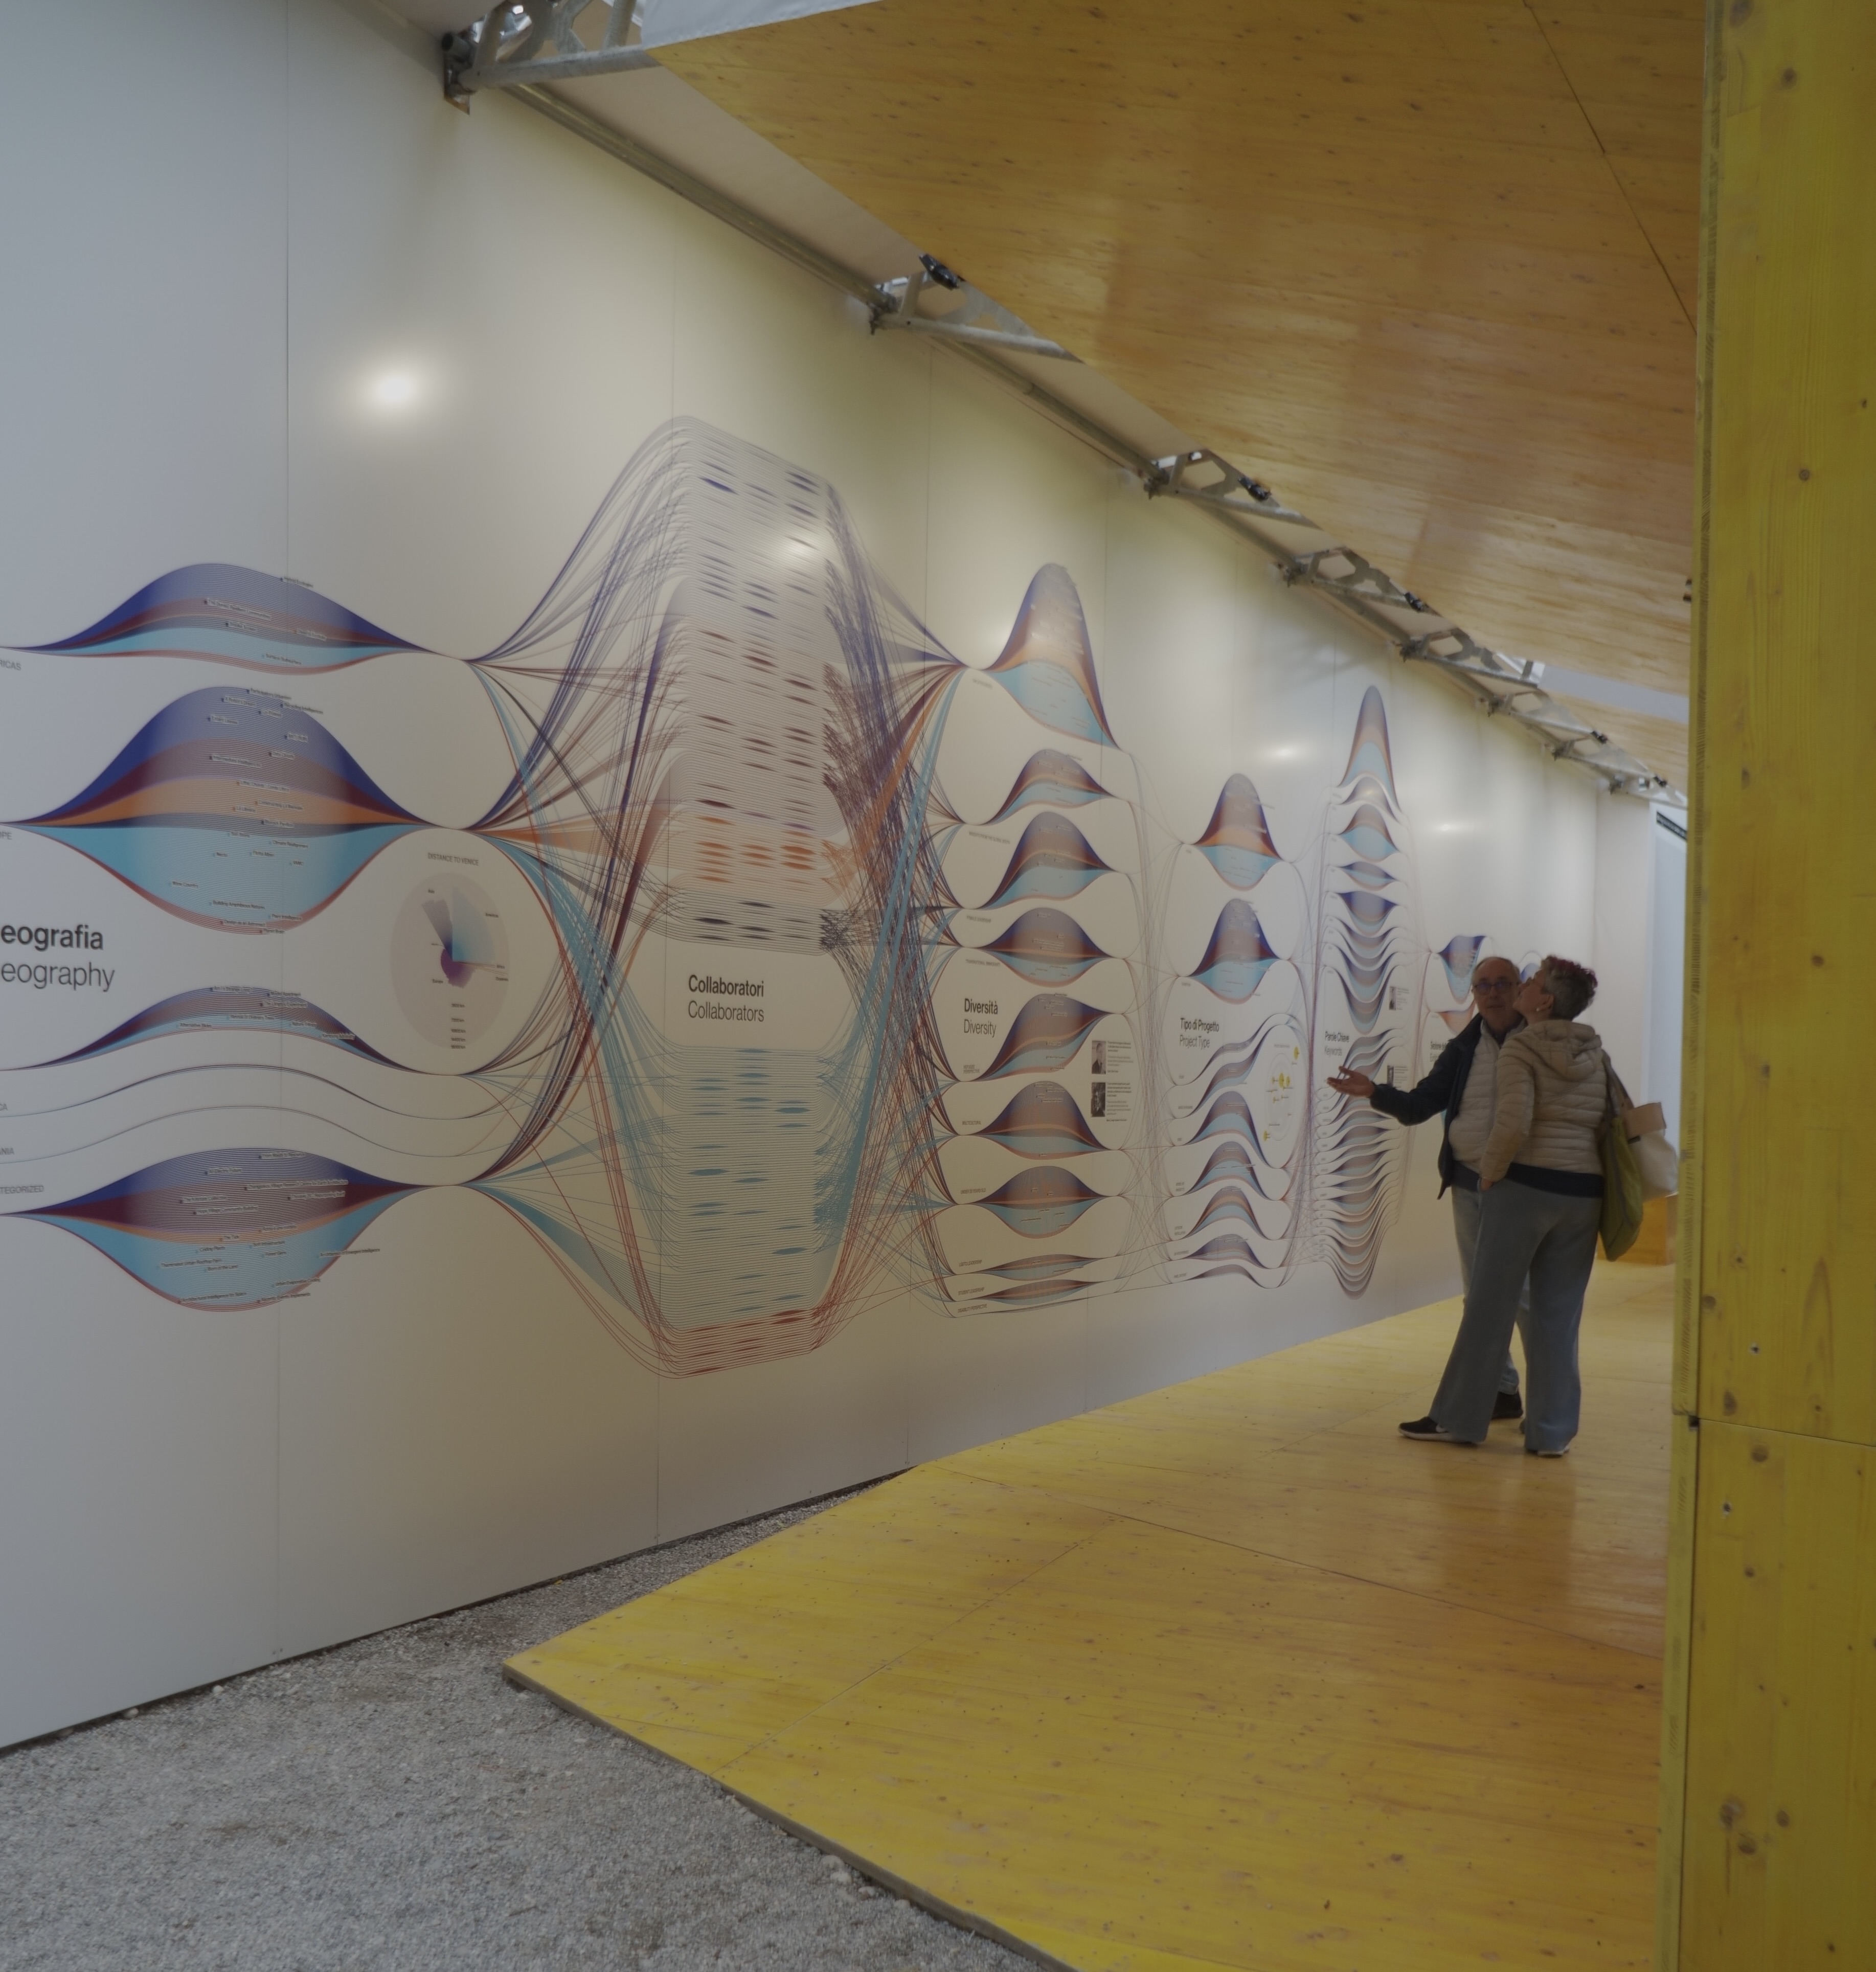
“Constructing la Biennale” addresses this challenge by revealing the “behind the scenes” of the event.
Positioned in front of the Padiglione Centrale, currently under renovation, a layered faux-façade offers a
critical interpretation of the historical evolution of la Biennale Architettura and the intricate
curatorship of the 2025 edition. This effort brings together architectural design, network science,
information design, data visualization, and ethnography of architecture—exploring the exhibition as a
layered object and unveiling the question: what shapes a Biennale?
By digitizing and analyzing data—such as team sizes and thematic focuses—the project visualizes la Biennale
Architettura from a historical perspective, spanning from 1975 to today. A dynamic network of actors, works,
and ideas reveals its evolving cultural significance. In parallel, the curatorial process of the 2025
edition is explored as a collaborative endeavor. By shadowing the curatorial team and employing a diverse
set of tools—data flows, maps, interviews, physical objects, and videos—the project captures the
socio-material complexity behind the exhibition, including its mediations and unseen technical efforts.
These insights uncover the interplay of global networks, local contexts, and interdisciplinary diplomacy
that often remain hidden behind the spectacle.
“Constructing la Biennale” reframes the exhibition as an open and dynamic ecology of relations, examining it
through layered historical and socio-cultural lenses, and offering a deeper understanding of its collective
agency and evolving identity.
Team
- Paolo Ciuccarelli - Team Lead
- Todd Linkner - Information Design & Data Visualization
- Matt Blanco - Information Design & Data Visualization
Sketches
For some time, the team did not have access to accurate data of the Biennale. Sketches played a large role to experiment with potential visualizations and visual metaphors for such a large amount and complex series of data. Many of the sketches were done using D3 to be able to easily create more accurate visualizations once we had the right data.


Eventually we decided to show a flow of the curatorial process of the Biennale. The flow would be a visual representation of the curatorial team and how they viewed the accepted works. The data was a mix of self-identified tags from the projects' authors and curatorial fields to shed light on the often opaque process that goes into curating La Biennale.
Role
Throughout the project I wrote the code that structured the main visualization before it was
further refined in Adobe Illustrator. Access to this year's Biennale data was provided by La Biennale Venezia
through the platform Podio. Relying on the platform's API, I built a scraper in Python to fetch all available
metadata for every project (both work accepted into the Biennale and not). Once the data was analyzed by Todd
Linkner, we decided which fields would be visualized and the types of projects we would focus on.
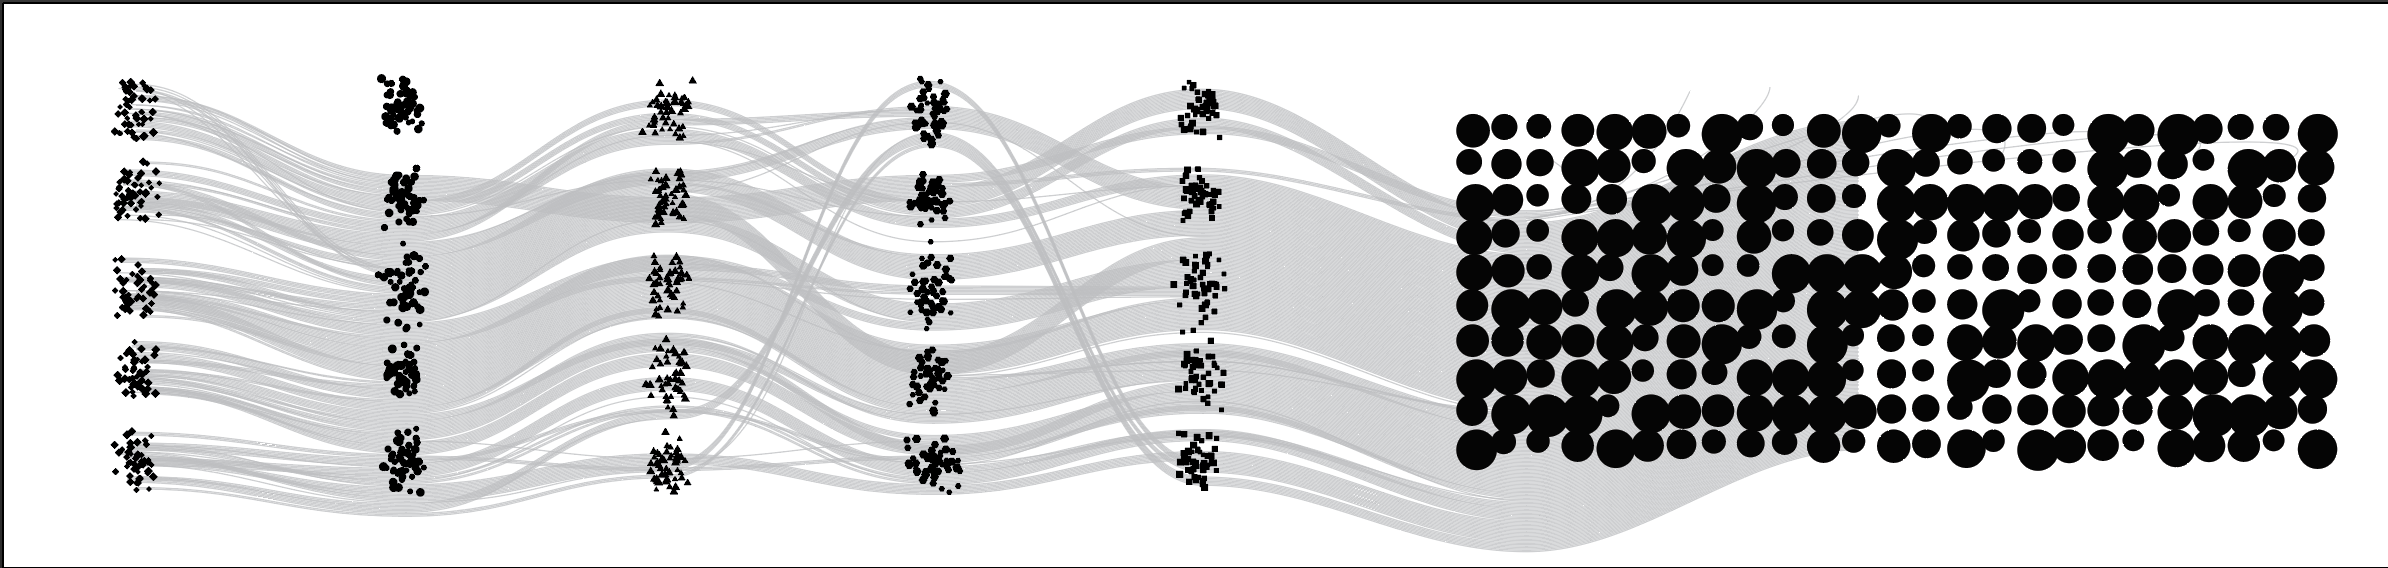
Once we had a clear understanding of the data, I wrote the code that would generate the main visualization.
Written using D3.js, the visualization aimed to showcase the various curatorial fields of the accepted projects.
Giving viewers the ability to see a shape of the curatorial process. Through a series of expanding
dendrograms, the flows saw how the metadata reflected the main curatorial themes of the Biennale: Artificial,
Natural, and Collective Intelligences. Once the work was completed in D3, using an algorithmic process of
iterating through each project and identifying where it should be placed within the flow.
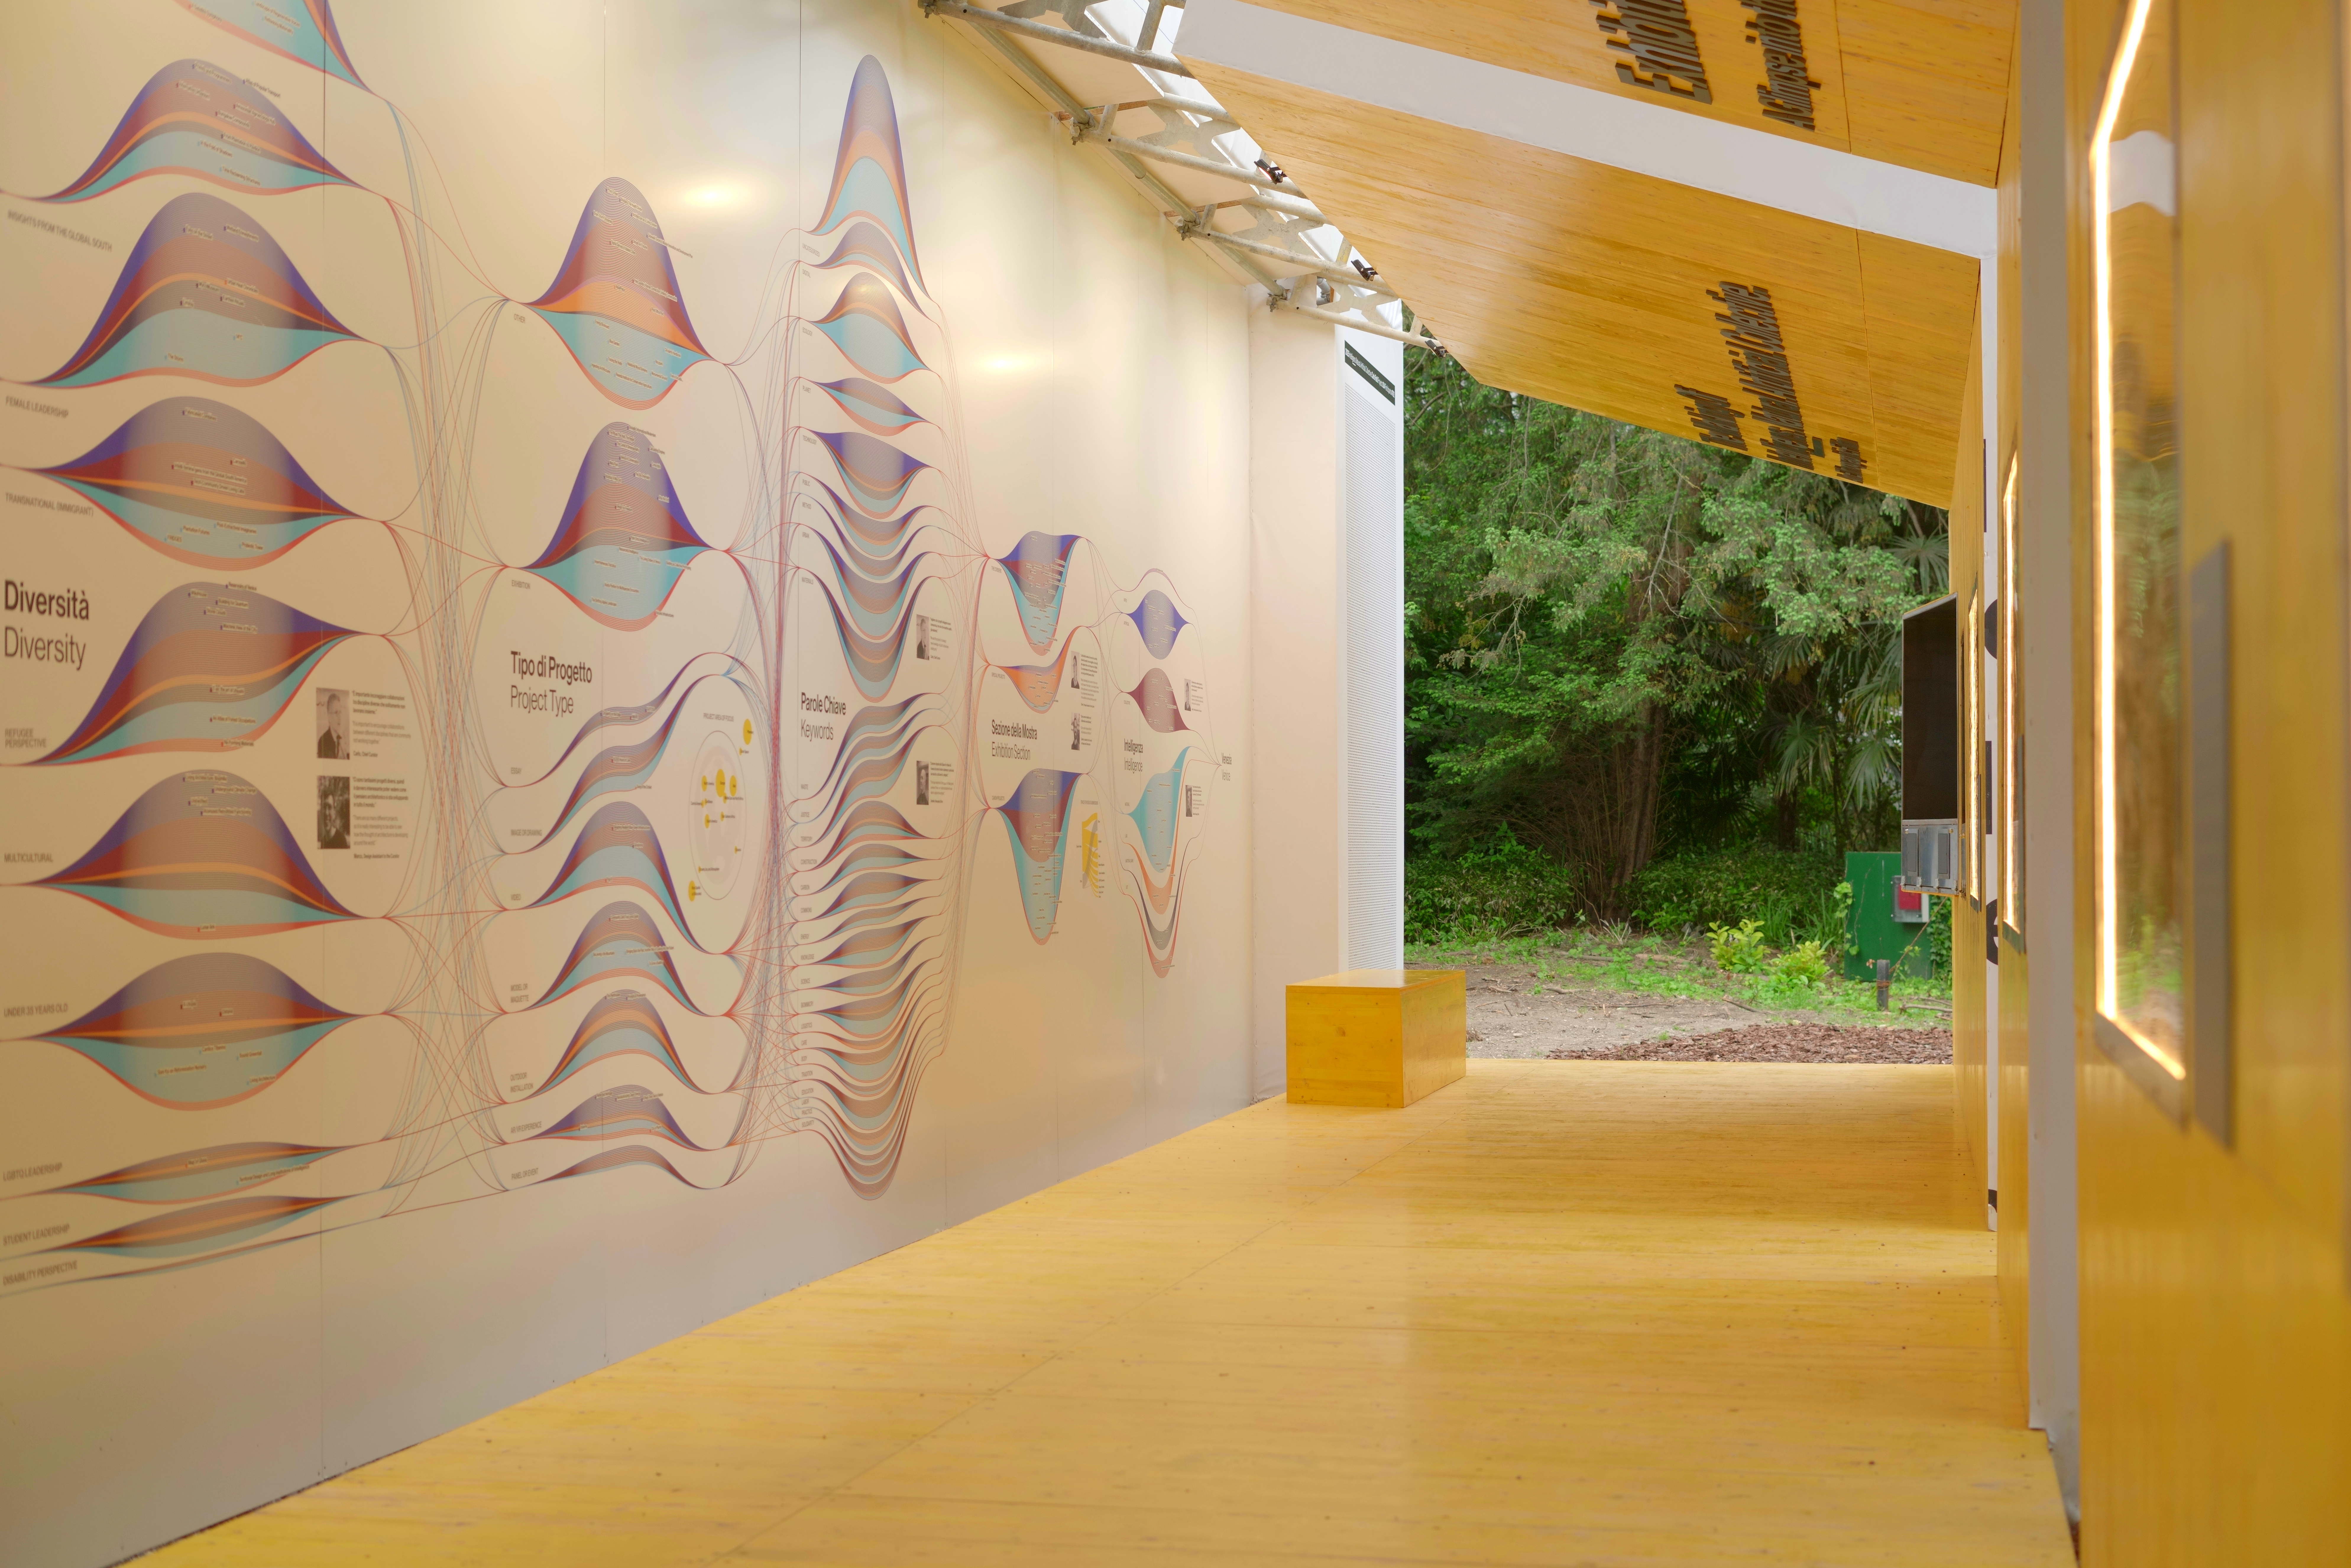
Final Installation