Exploring Hidden Worlds
[Exploratory Visualization]
Researcher - Undergraduate thesis
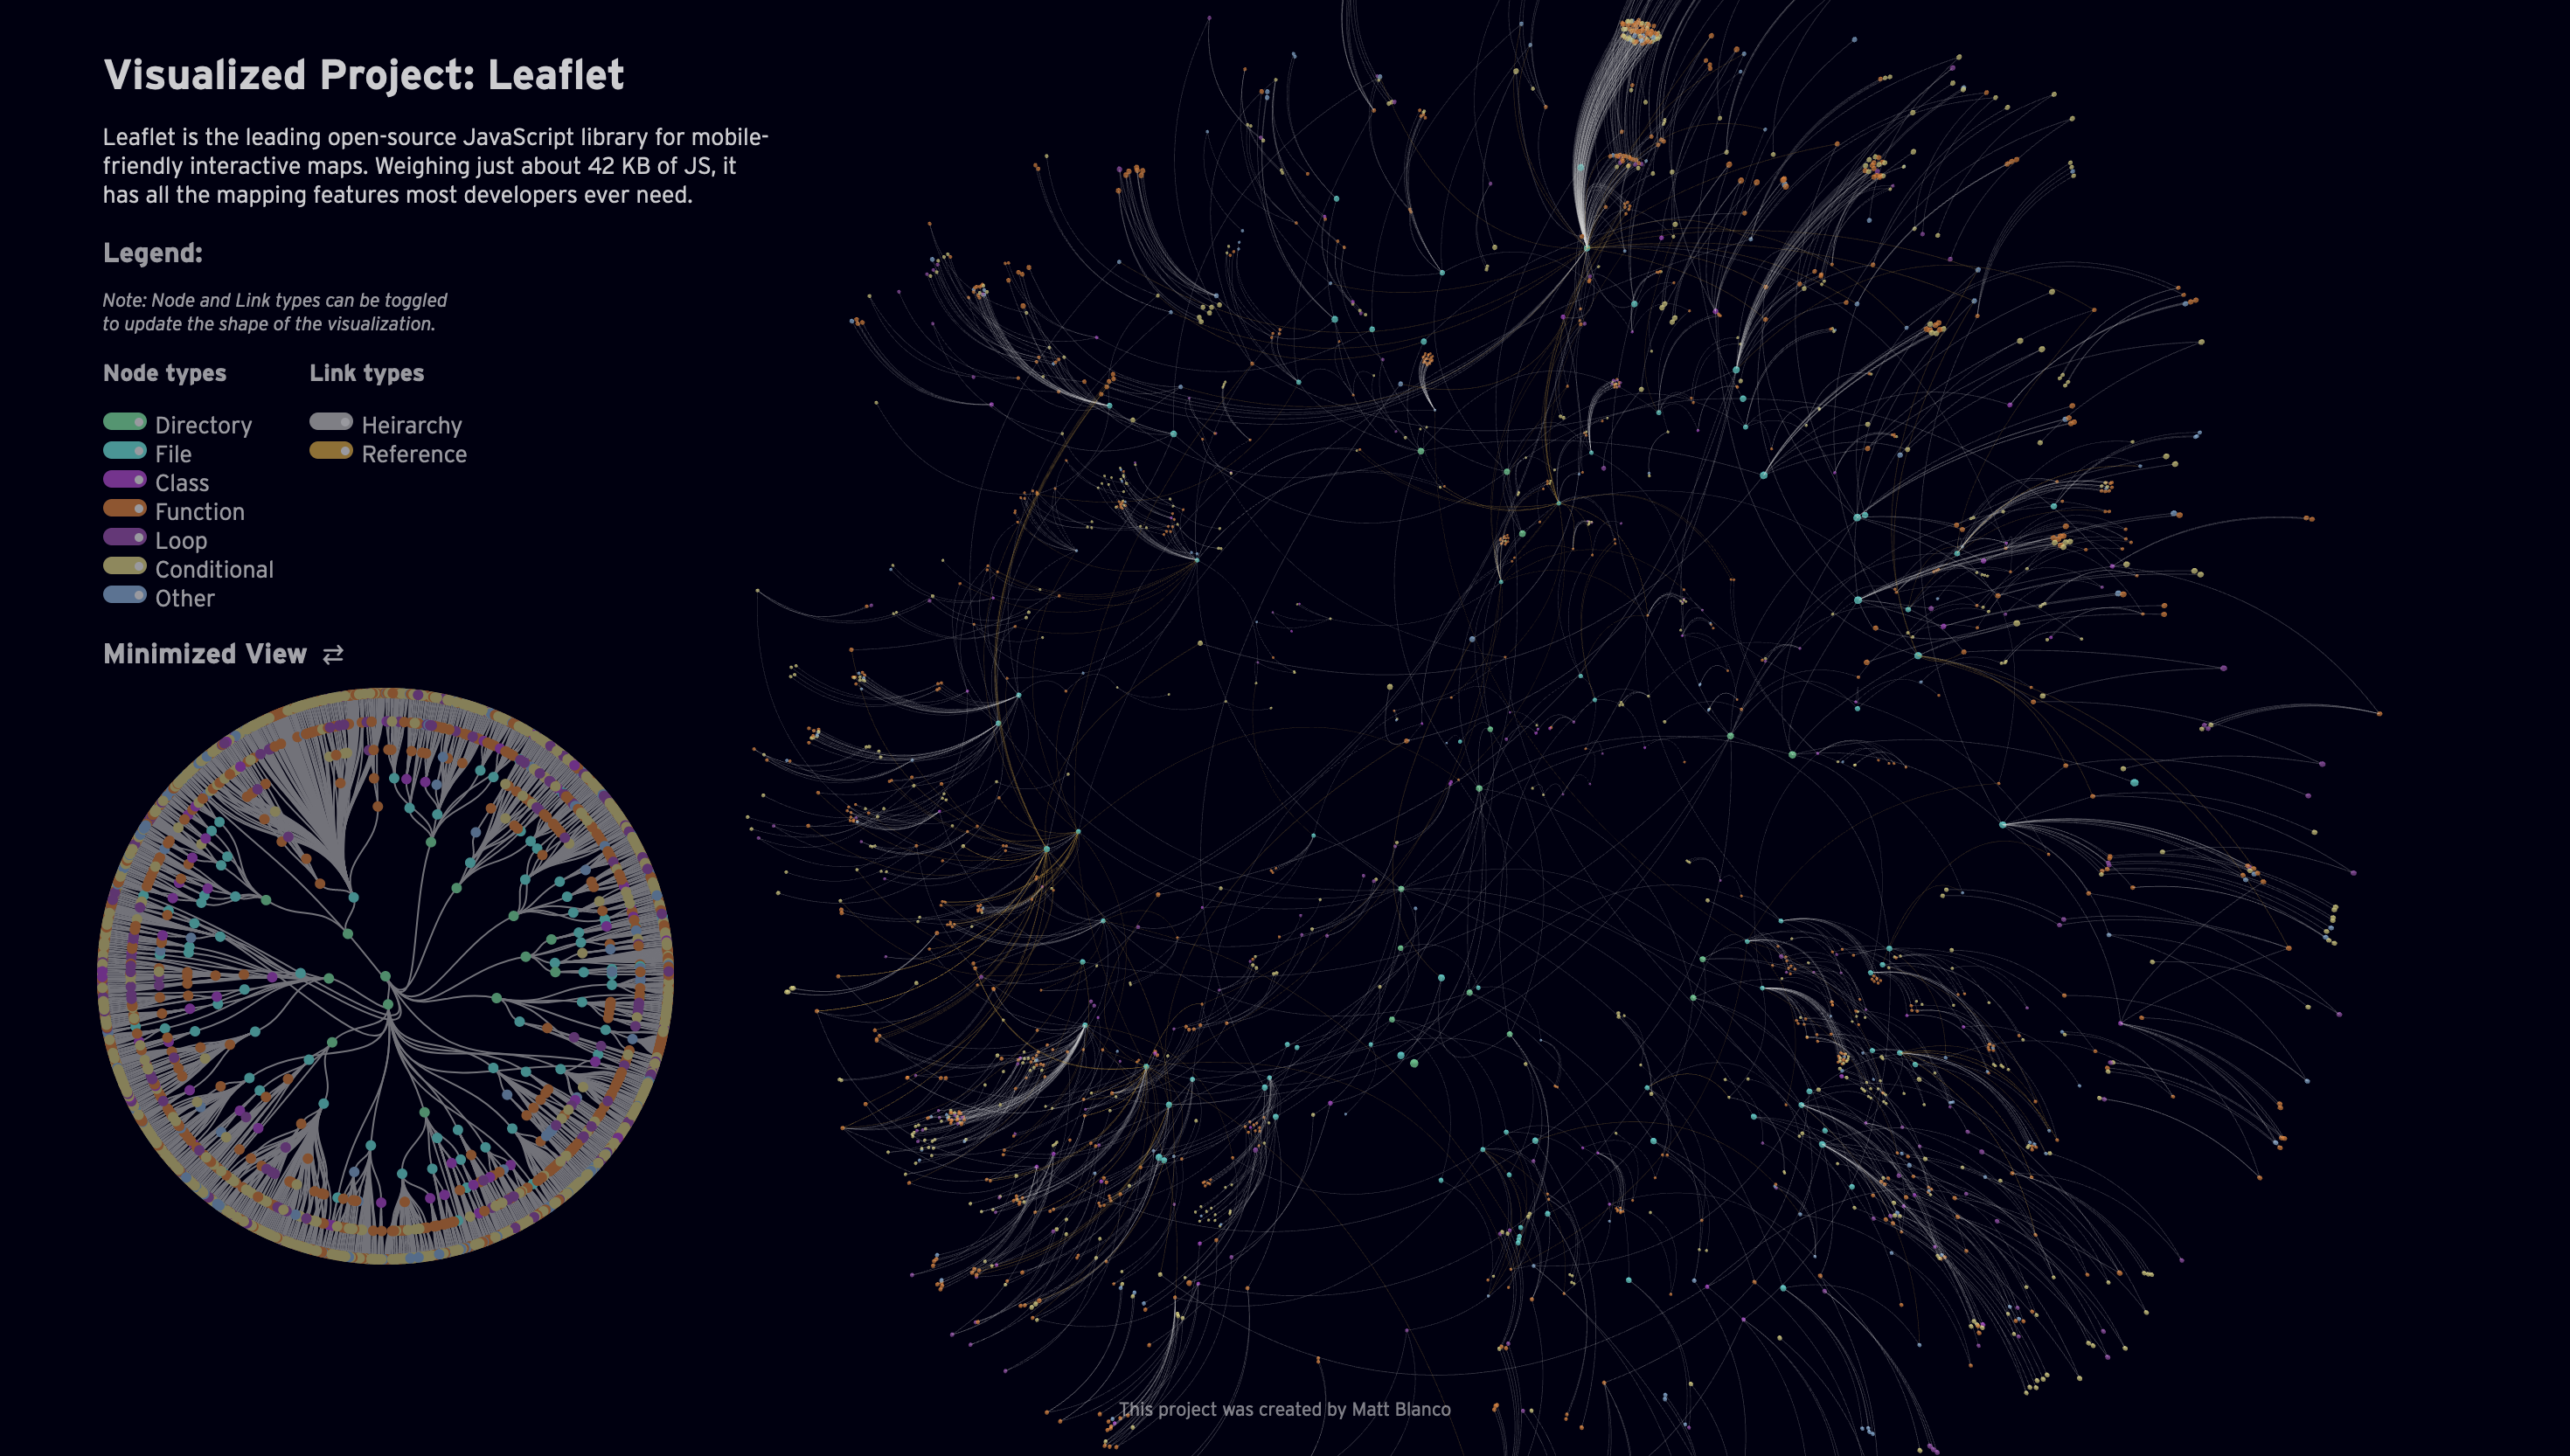
We are becoming more dependent on technology, and yet fewer people know how it works. Software should not be created behind closed doors especially when it can have larger ramifications on our day-to-day lives. Exploring Hidden Worlds aims to lift the veil on what it takes to build modern software through an explorable 3D visualization. Through learning what it takes to build modern software, and having the ability to understand it people can have more agency when deciding whether to adopt new, potentially harmful, technologies.
Passing Time
[Data Visualization]
Designer / Developer
What begain as a piece of art as a gift to a friend, turned into creating abstract visualizations of weather over the course of a year. Using historic weather data of Sanibel Florida, organic forms are generated based on the temperature, cloud cover, and rainfall of the city. The visual system can also be used to create visualizations for any location on Earth.
Surf's Up
[Multimedia Visualization]
Designer
Assisting a four-day workshop hosted by the Ars Electronica FutureLab, Surf's Up attempts to bridge geographies by visualizing wave data from Nazaré, Portugal while attempting to bring together our natural and built environments.
Olli
[Accessible Visualization Tool]
Researcher
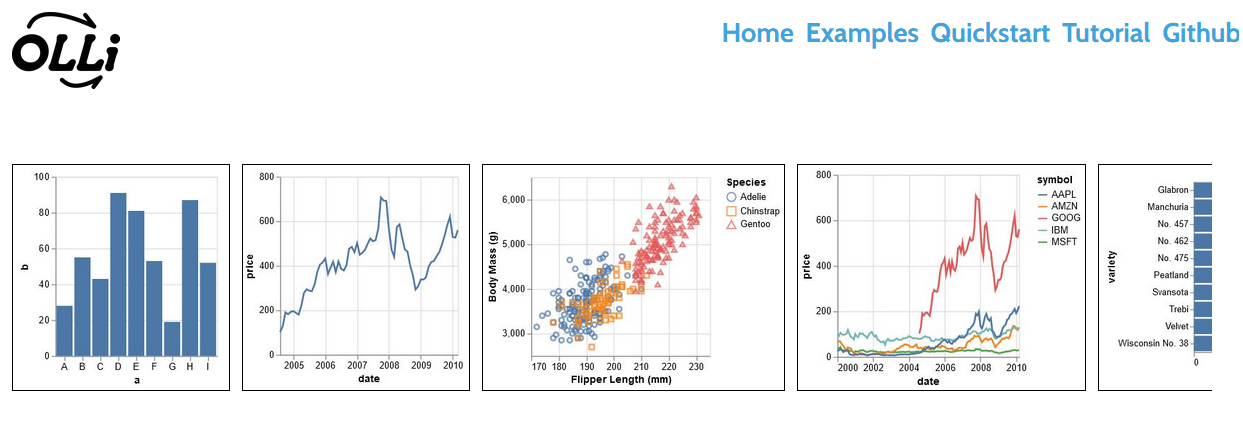
While working for the MIT Visualization Group I developed version 1.0 of Olli. An open-source library for converting data visualizations into accessible text structures for screen reader users. Starting with an existing visualization specification created with a supported toolkit, Olli produces a keyboard-navigable tree view with descriptions at varying levels of detail. Users can explore these structures both to get an initial overview, and to dive into the data in more detail.
eyeWatch
[Service Design]
Designer
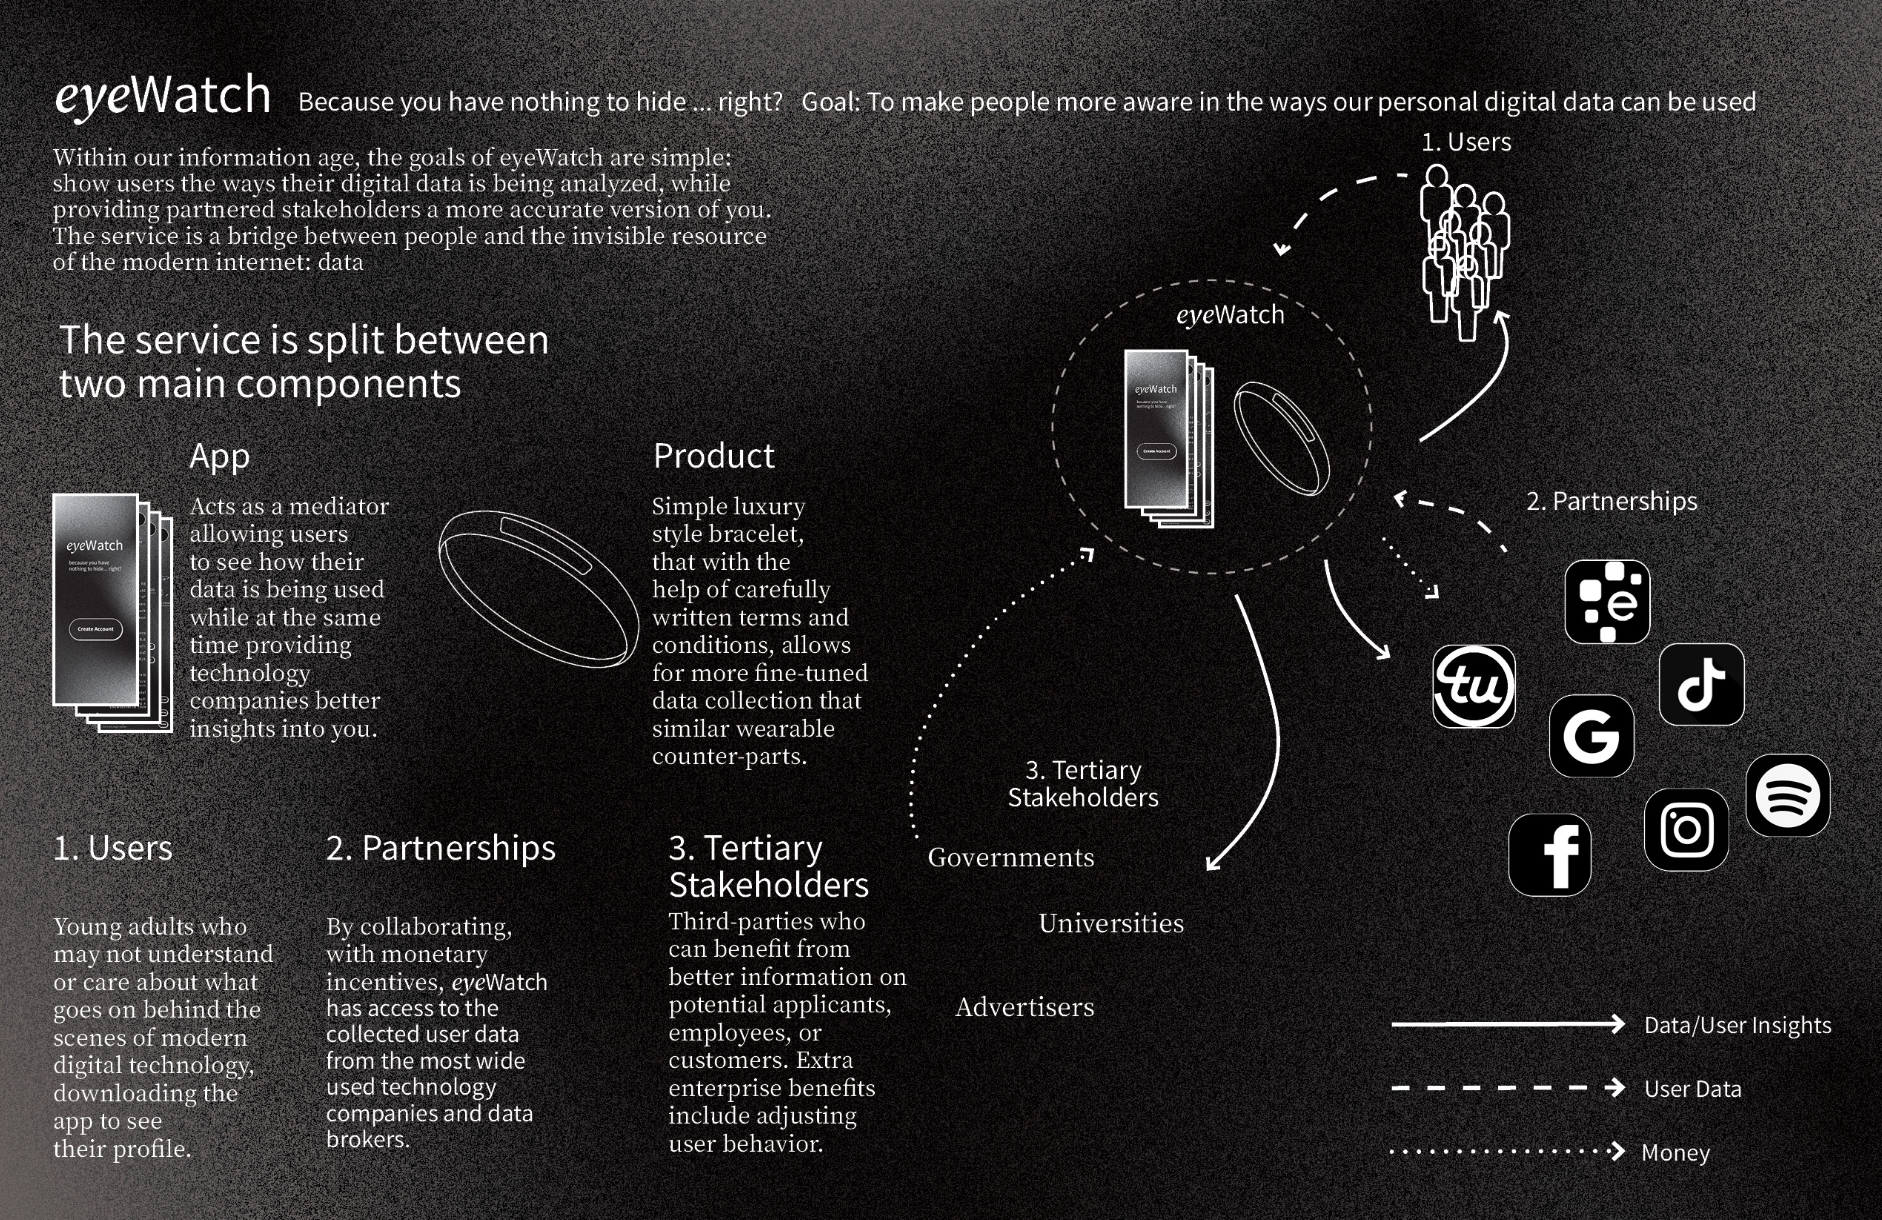
A speculative service design project done for my design capstone creating an absurd app to showcase how our data is collected putting it front and center for the user. The goal of the service is to show users the amount of data that is being collected, how it can be used to affect your bevavior, and the stakeholders who want to control your data in an effort to bridge the gap between people and the often intangible resource of the 21st century.
Intesa SanPaolo Processes
[Data Visualization Platform]
UI & Visualization Developer
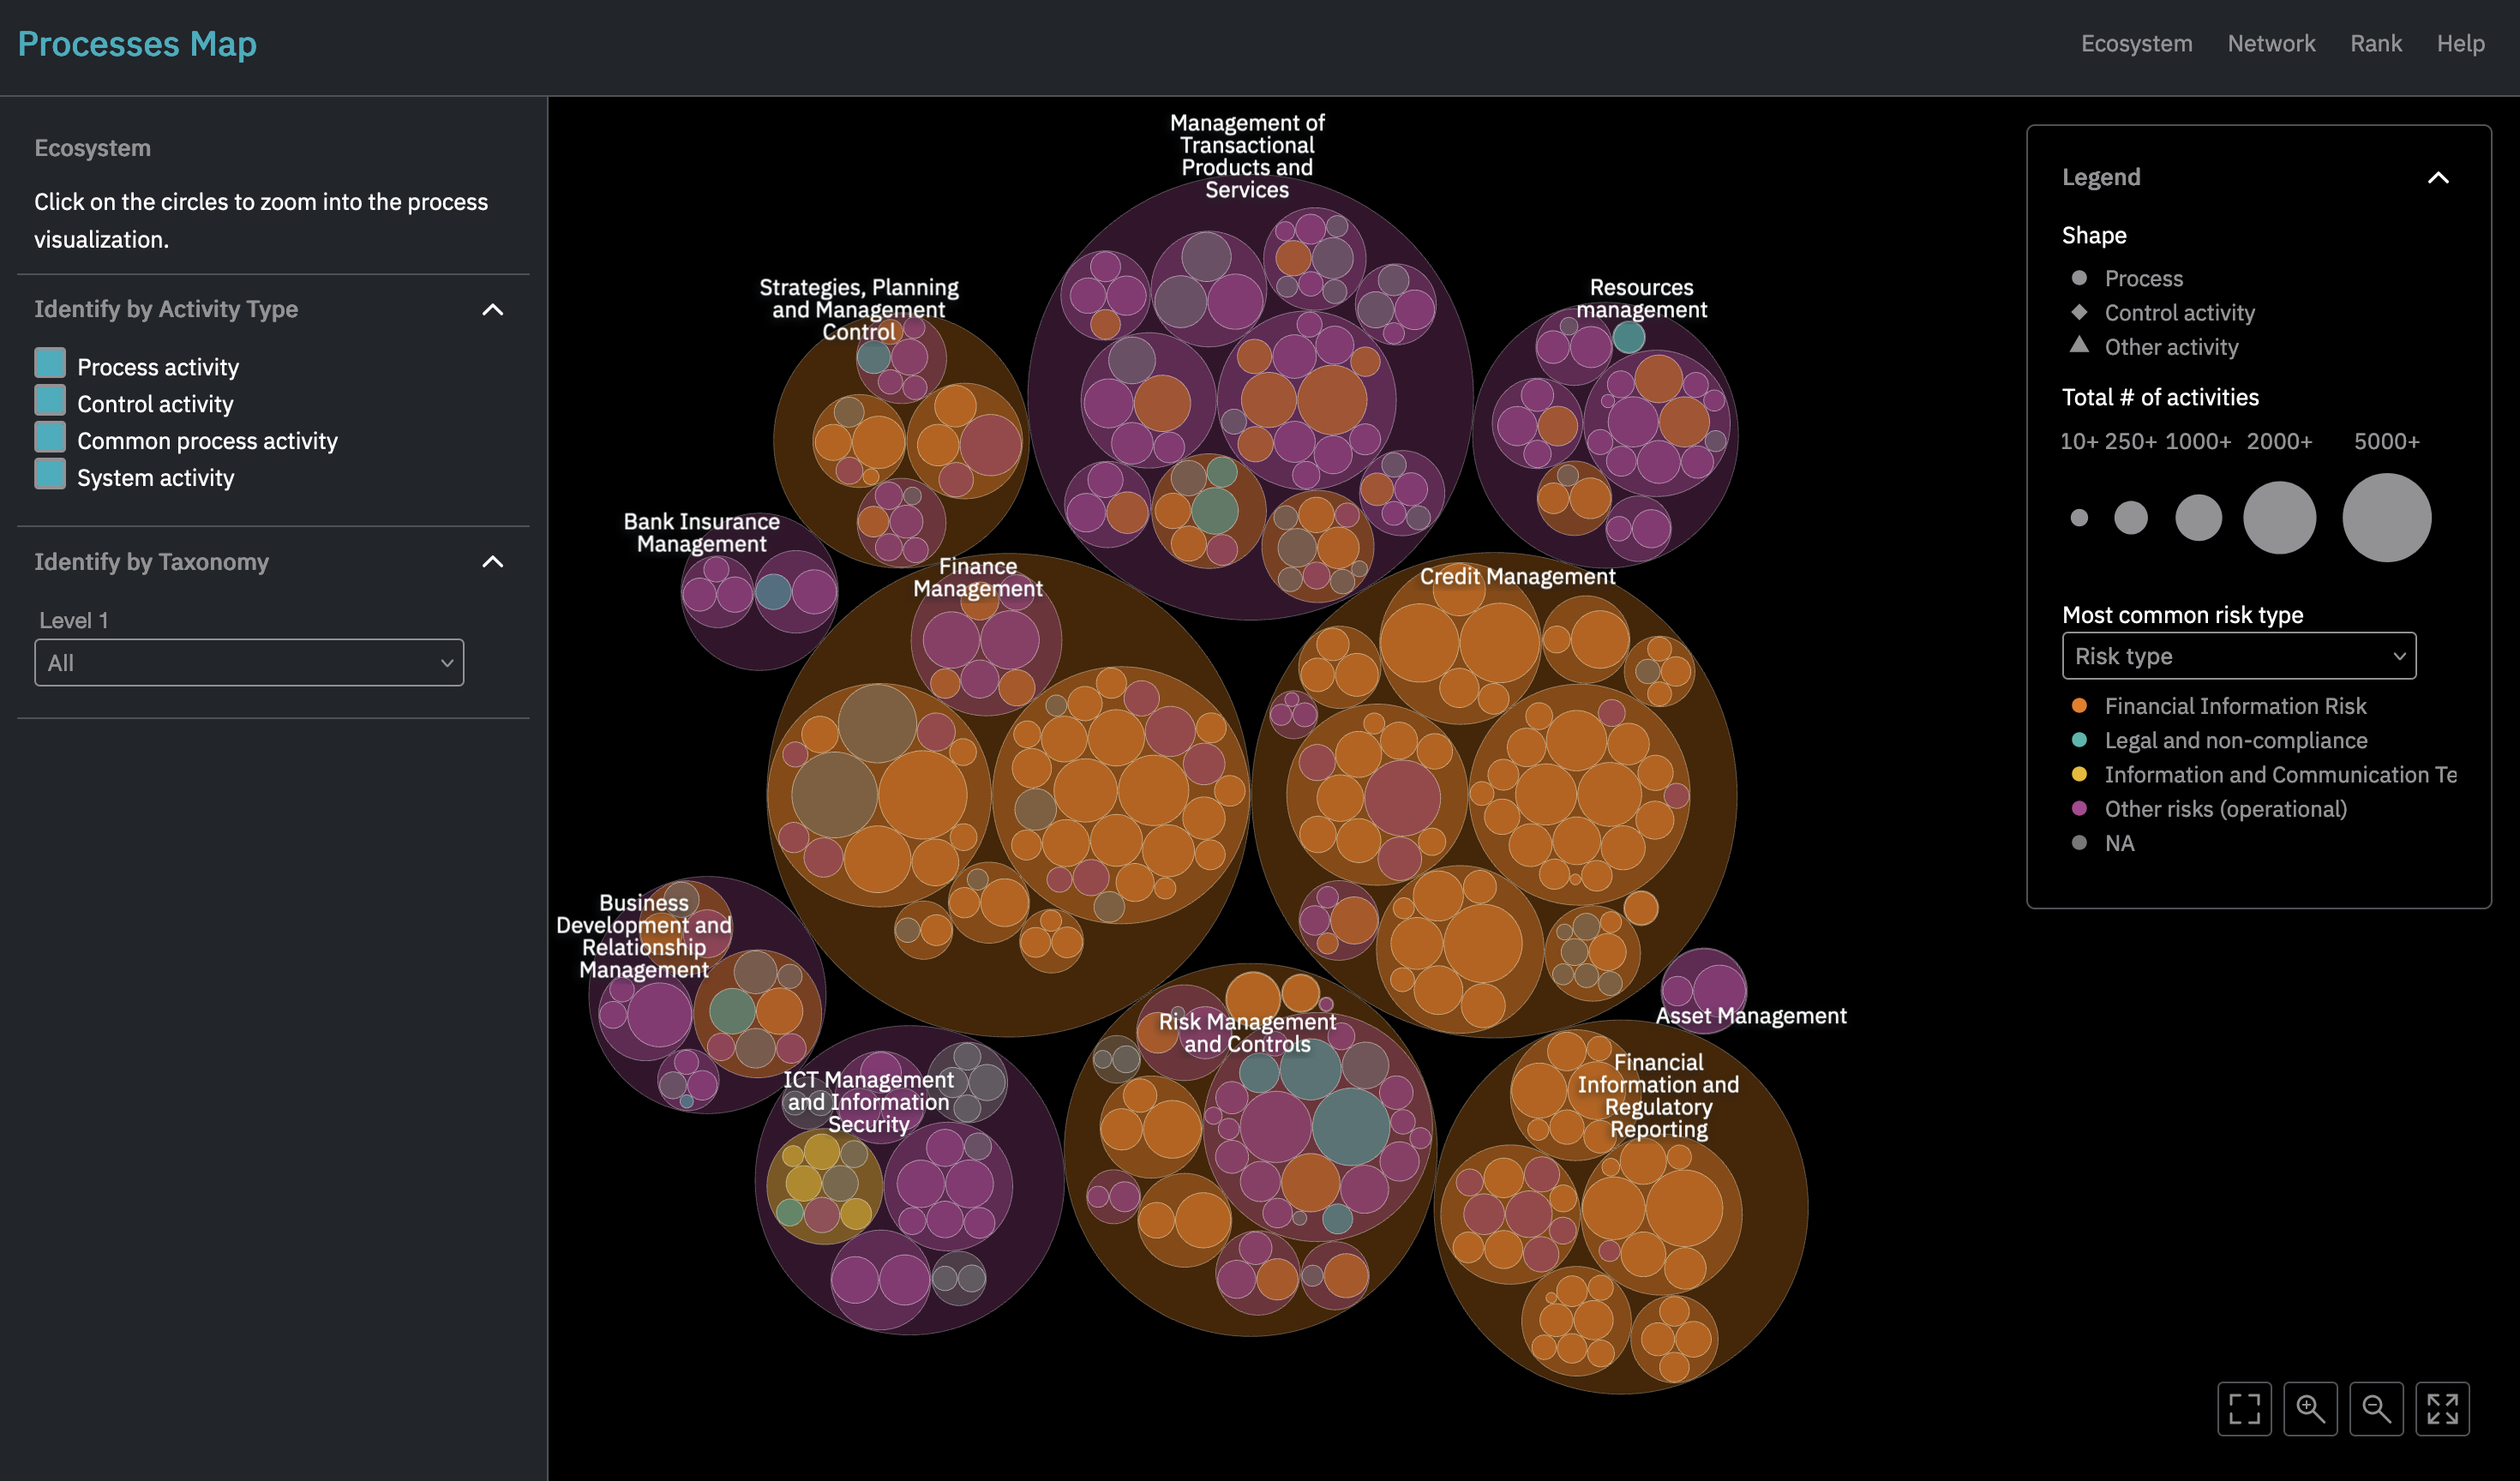
As a student developer & researcher at the Center for Design I worked with a team alongside Banca Intesa Sanpaolo, Italy's largest bank, to create a visualization interface to explore auditing risk and management data throughout different levels of the company