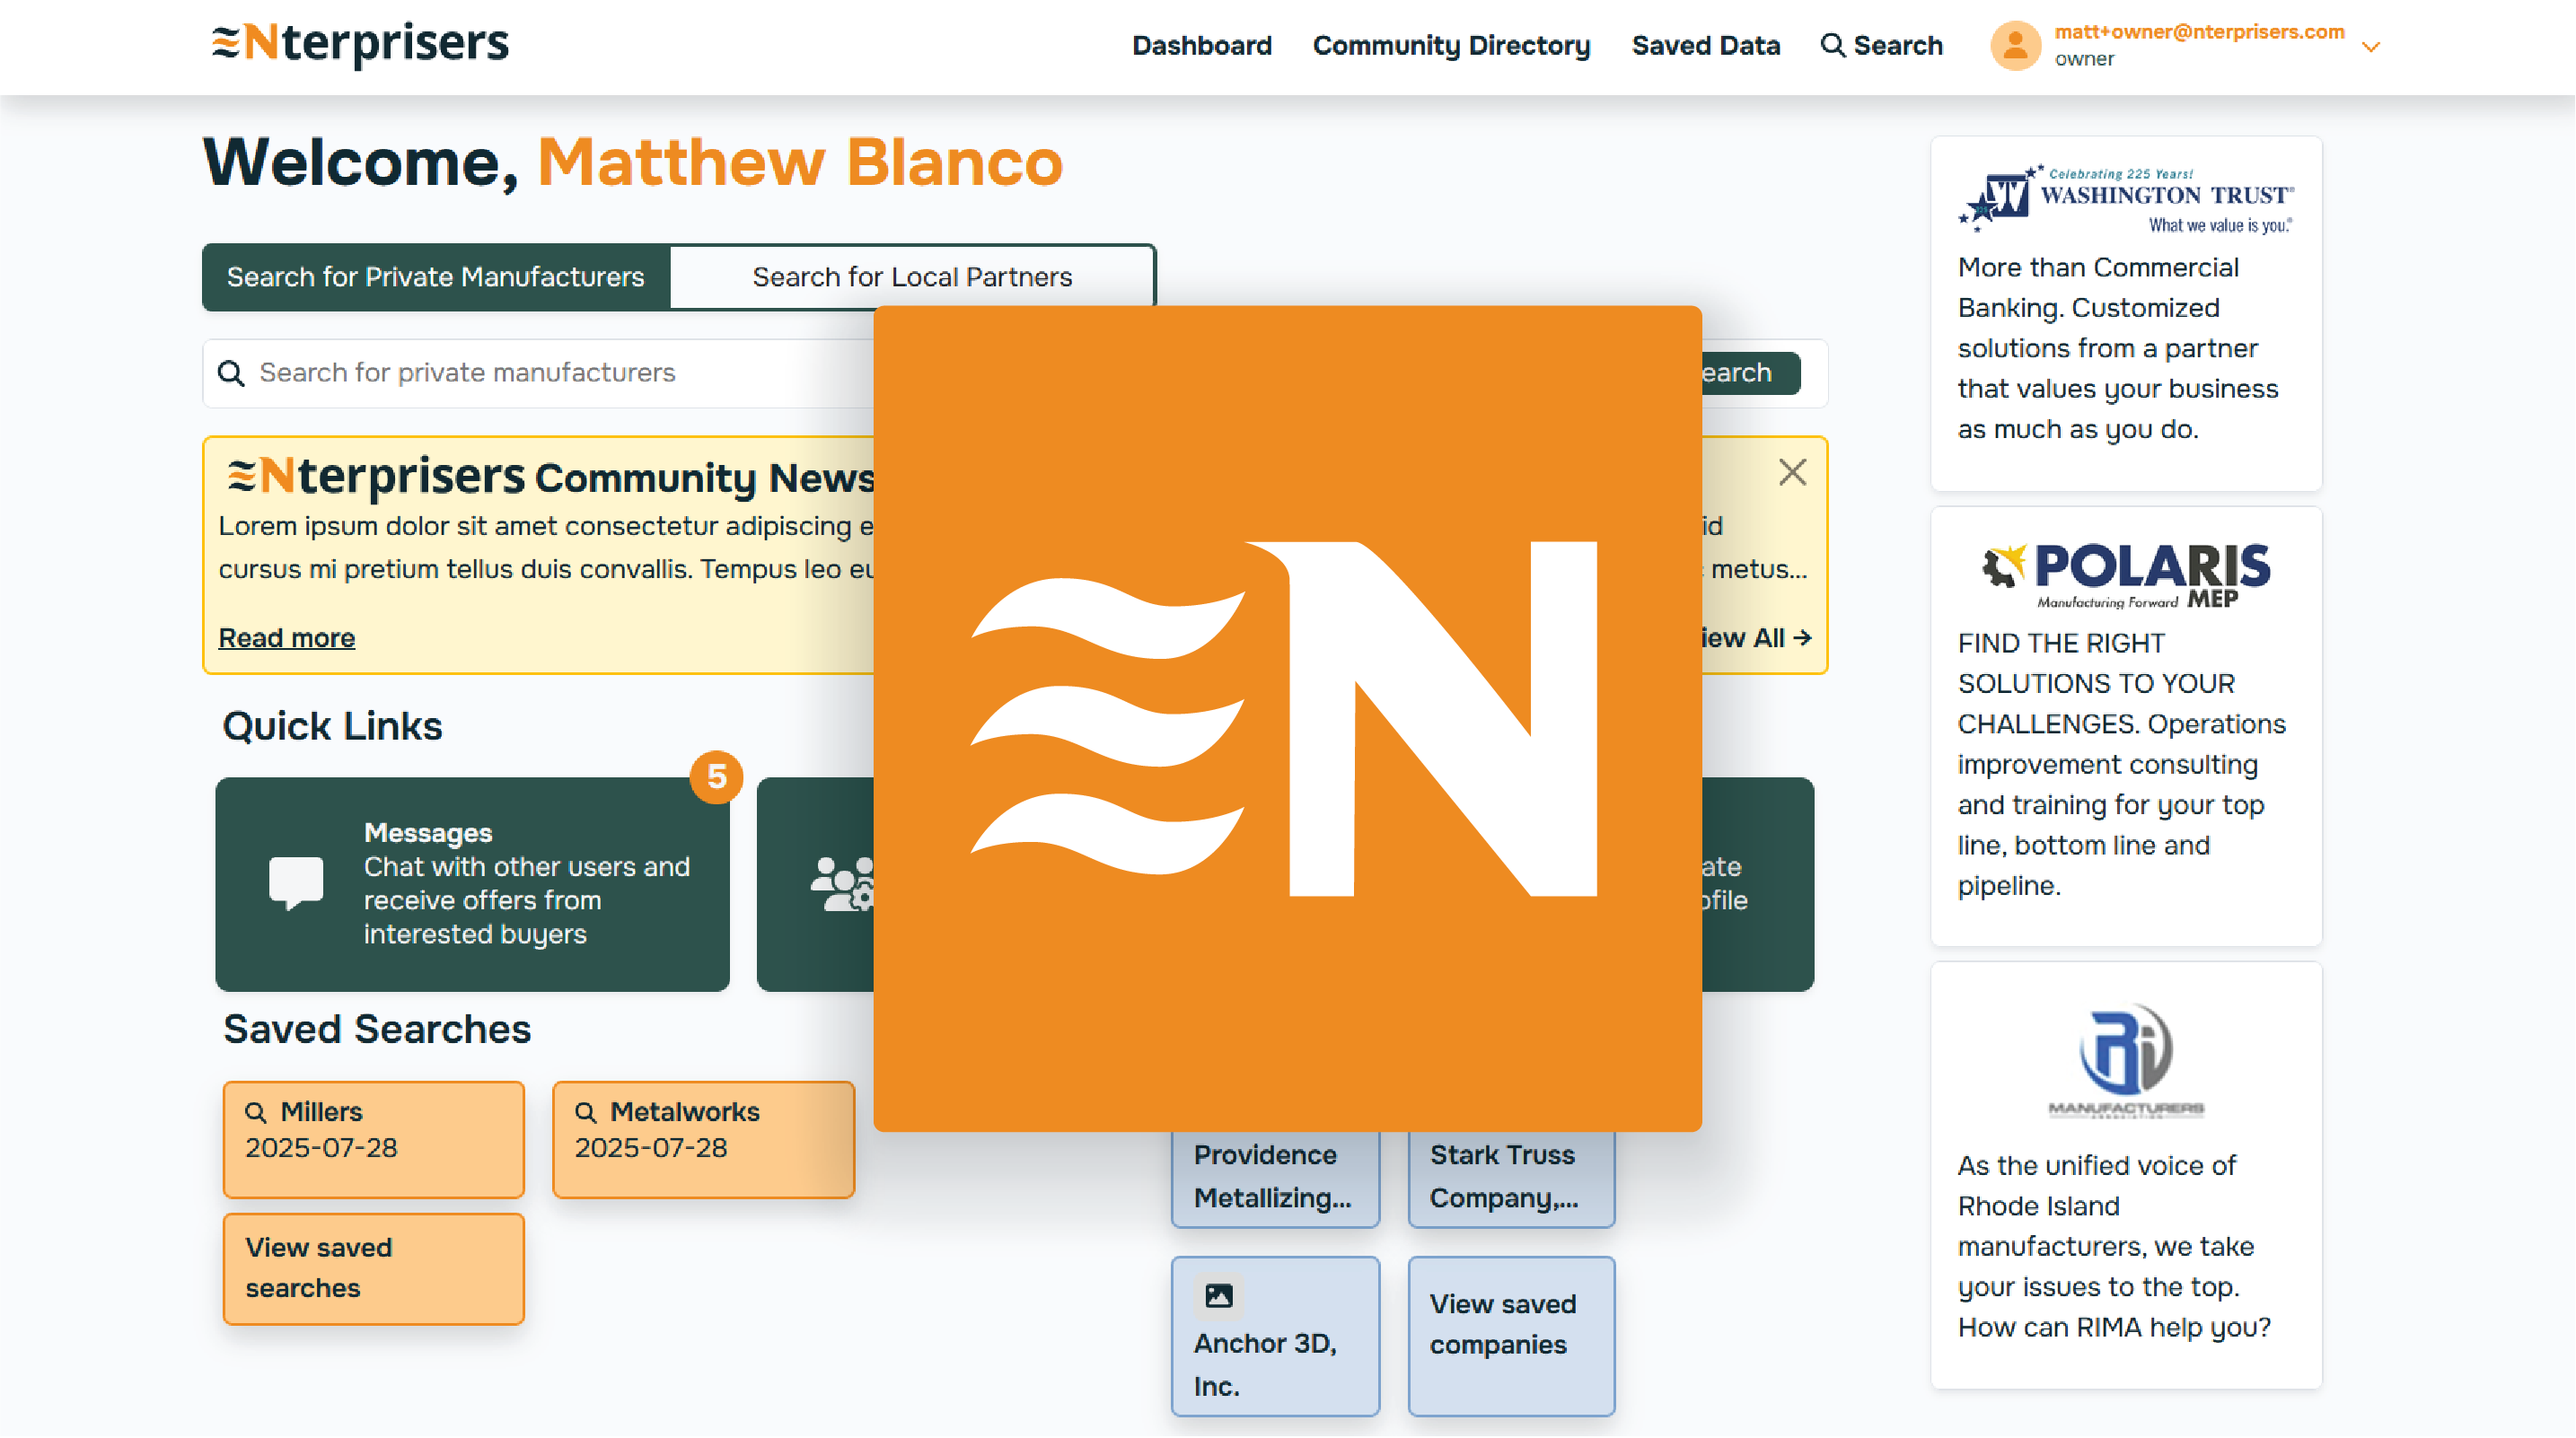
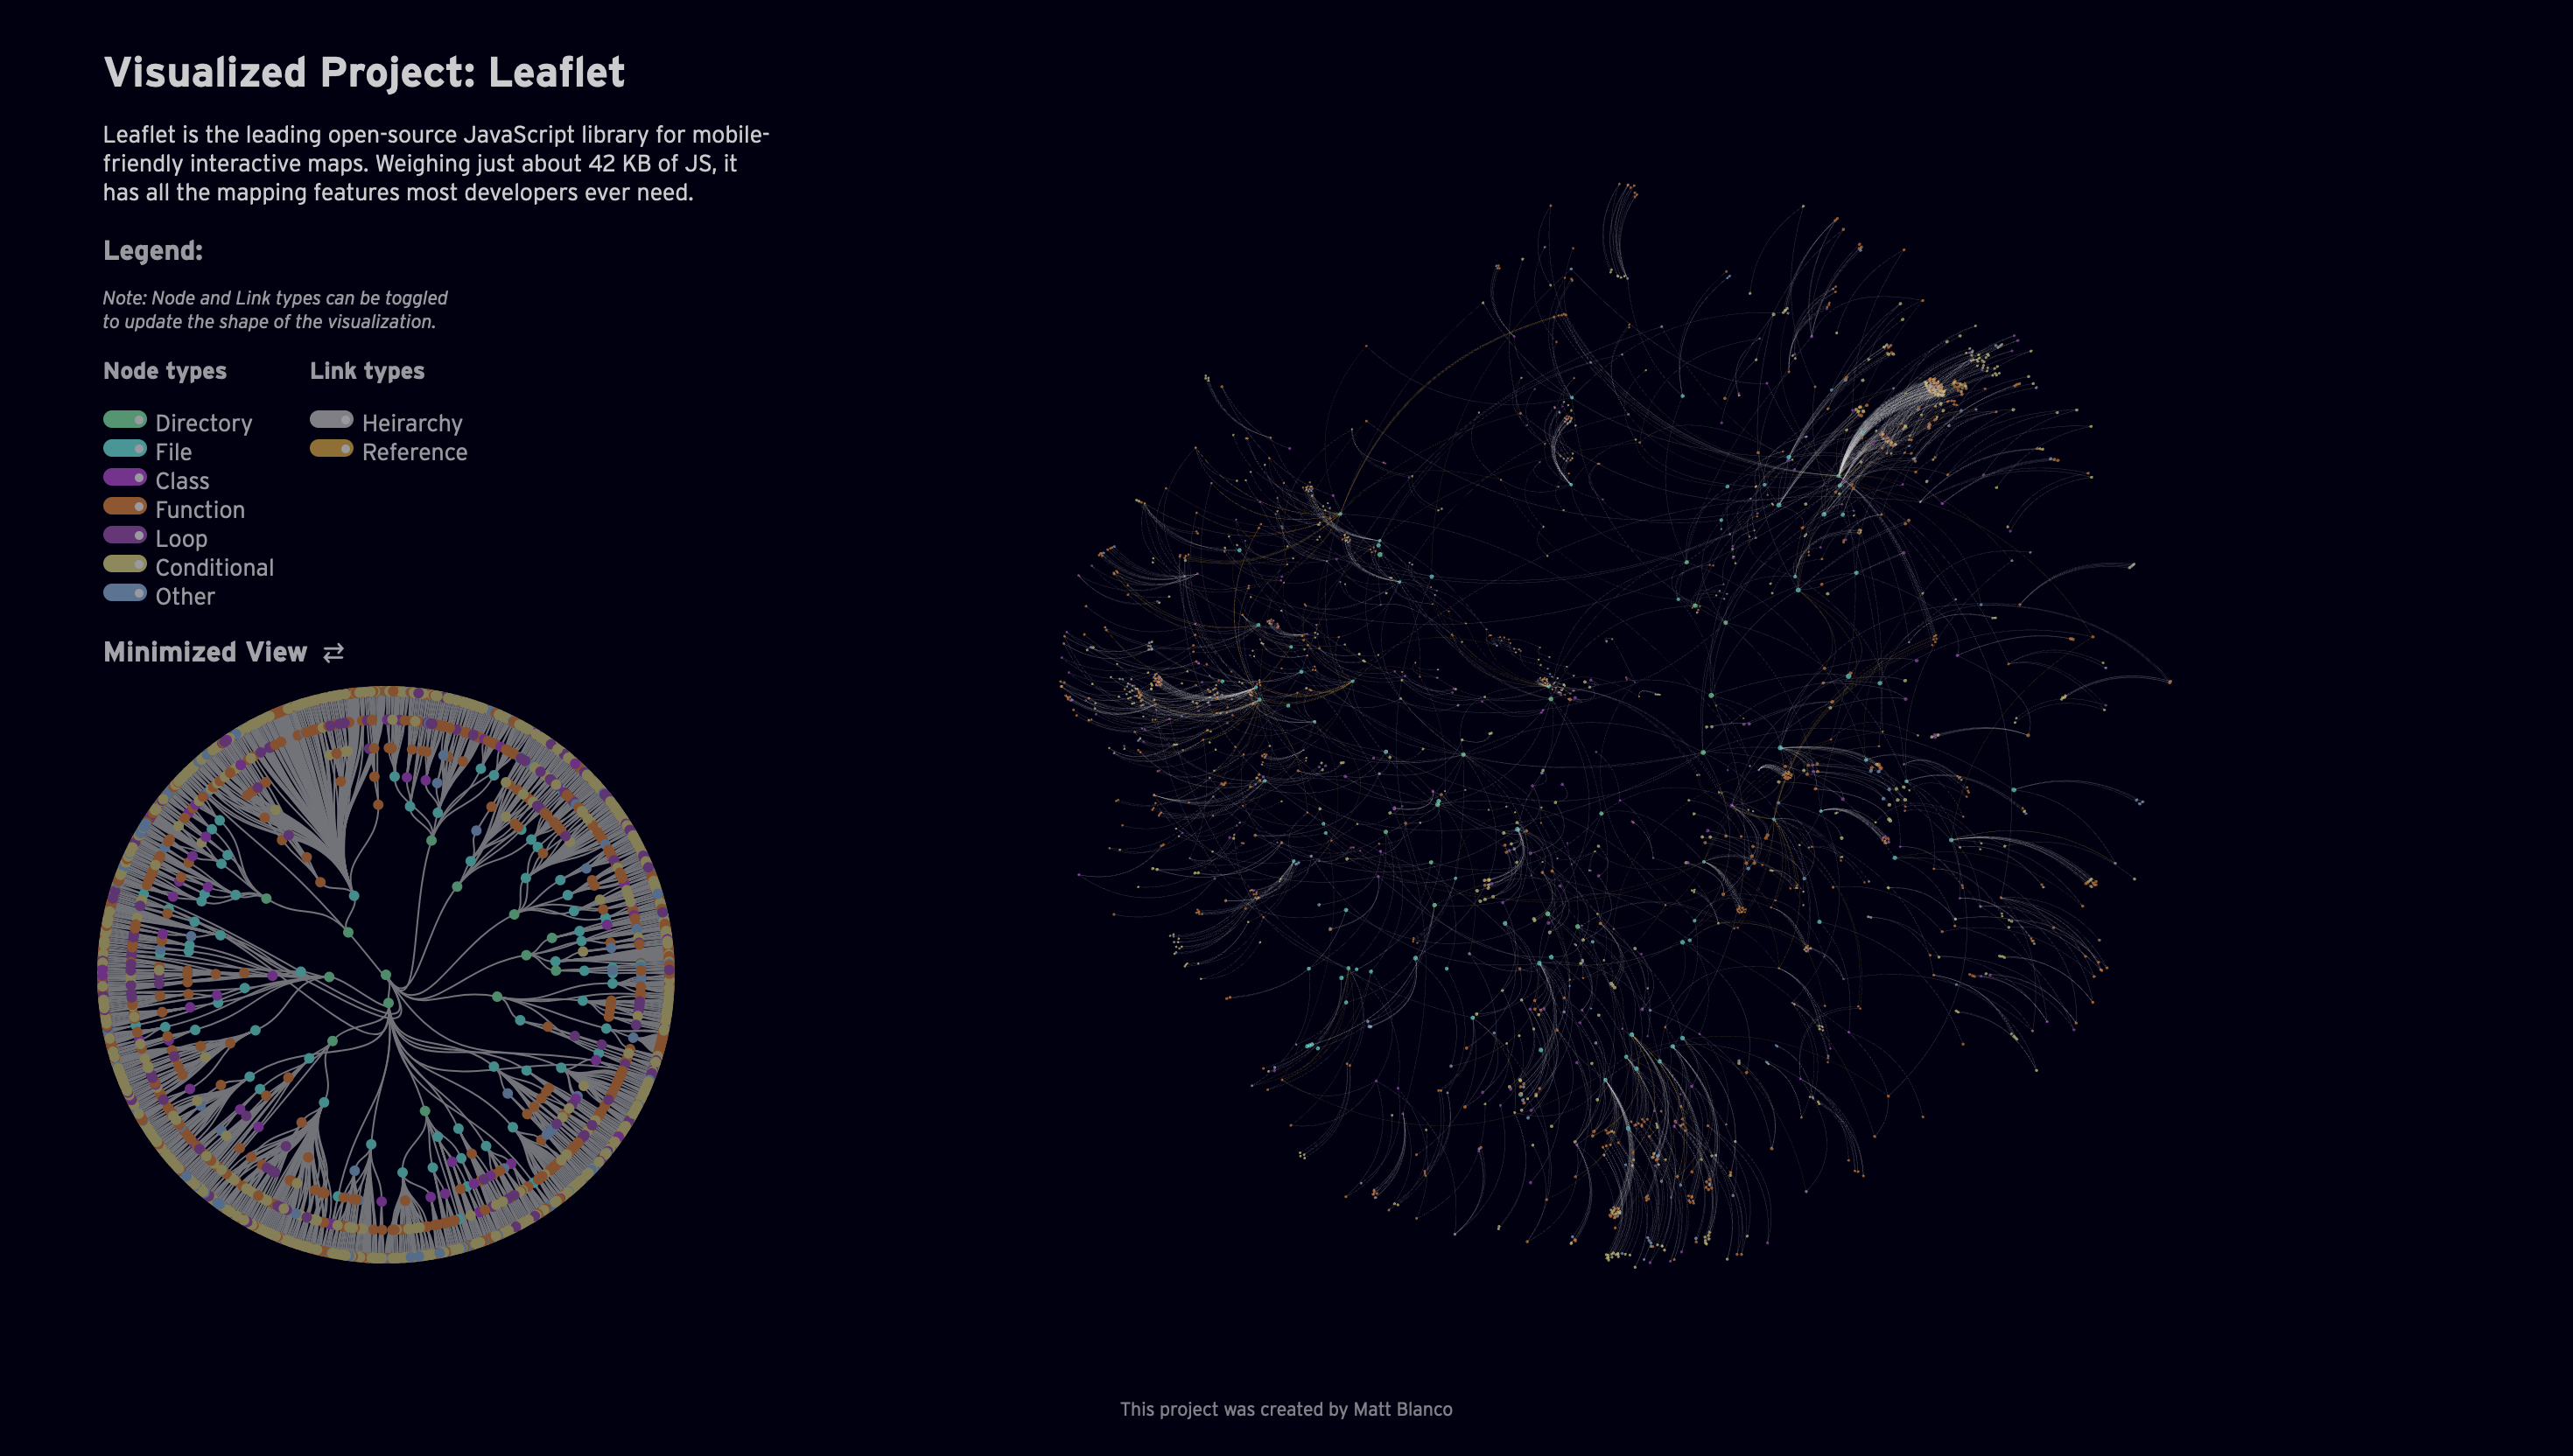
I'm a design engineer & adventurer based in New York City. Through design I observe how we interact with digital technology and complex information and try to make everything a little easier to understand. Currently I'm pursuing a Masters at NYU's Interactive Telecommunications Program (ITP) where I am experimenting with new methods of interaction and fabrication. I have been previously affiliated with Nterprisers as their lead UI Developer, the Center for Design as a student researcher, and the Visualization Group at MIT CSAIL.
A handheld device that incorporates the addictive and satisfying elements of a smartphone into a simple analog gadget. With a ferrofluid display and few interface elements, the P.E.D creates a visual, audible, and tactile feedback loop keeping users engaged.
Exhibited in the 19th International Venice Biennale of Architecture, and as part of 'Constructing La Biennale', Stretching across a 23-meter-long wall, this critical visualization unpacks the curatorial process behind the exhibition Intelligens. Natural. Artificial. Collective. From this nexus, threads representing the selected applications and projects extend, unfolding through the interpretative dimensions of curation. Ethnographic insights, presented as excerpts from interviews, further enrich the narrative by adding depth and context.
During 2025 I was working for Nterprisers as their sole UI Developer & Designer, I had rebuilt their platform for small manufacturing business communication. From exploring new visual designs to improving the interaction design of the Nterprisers Platform. The work culminated in brand new software architecture and interface aesthetic as their user base grew.
Exhibited in the 19th International Venice Biennale of Architecture, and as part of 'Constructing La Biennale', Stretching across a 23-meter-long wall, this critical visualization unpacks the curatorial process behind the exhibition Intelligens. Natural. Artificial. Collective. From this nexus, threads representing the selected applications and projects extend, unfolding through the interpretative dimensions of curation. Ethnographic insights, presented as excerpts from interviews, further enrich the narrative by adding depth and context.
We are becoming more dependent on technology, and yet fewer people know how it works. Software should not be created behind closed doors especially when it can have larger ramifications on our day-to-day lives. Exploring Hidden Worlds aims to lift the veil on what it takes to build modern software through an explorable 3D visualization. Through learning what it takes to build modern software, and having the ability to understand it people can have more agency when deciding whether to adopt new, potentially harmful, technologies.
What begain as a piece of art as a gift to a friend, turned into creating abstract visualizations of weather over the course of a year. Using historic weather data of Sanibel Florida, organic forms are generated based on the temperature, cloud cover, and rainfall of the city. The visual system can also be used to create visualizations for any location on Earth.
Assisting a four-day workshop hosted by the Ars Electronica FutureLab, Surf's Up attempts to brigde geographies by visualizing wave data from Nazaré, Portugal while attempting to bring together our natural and built environments.
Photography has become a hobby for everyone. However, no matter the type of camera, or editing tool, used there is hidden information within every photo.
Based on a mural in the Museum Quartier in Vienna, the project to combine graphic design and computer science principles to create patterns out of simple squares and rectangles.
A speculative service design project done for my design capstone creating an absurd app to showcase how our data is collected putting it front and center for the user. The goal of the service is to show users the amount of data that is being collected, how it can be used to affect your bevavior, and the stakeholders who want to control your data in an effort to bridge the gap between people and the often intangible resource of the 21st century.
It is common practice for designers to have a lot of collected artifacts to look back on or inspire them throughout the design process. The visualization showcases the archive of design artifacts that can be found throughout my apartment.
As a student developer & researcher at the Center for Design I worked with a team alongside Banca IntesaSanpaolo, Italy's largest bank, to create a visualization interface to explore auditing risk and management data throughout different levels of the company
A semester long project focused on rethinking our relationship to the outdoors. Organized as three parts: a poster, dimensional, and screen based series all focused on the same social cause and to practice different aspects of design.
While working for the MIT Visualization Group I developed version 1.0 of Olli. An open-source library for converting data visualizations into accessible text structures for screen reader users. Starting with an existing visualization specification created with a supported toolkit, Olli produces a keyboard-navigable tree view with descriptions at varying levels of detail. Users can explore these structures both to get an initial overview, and to dive into the data in more detail.
Collaborating as part of a small team in the Center for Design, we partnered with Banca Intesa Sanpaolo, Italy's largest bank, to design and develop an interactive visualization platform for managers to understand knowledge distribution throughout the bank, and see through interactive explorations which sections of the company were more knowledgeable about various aspects of company operations.