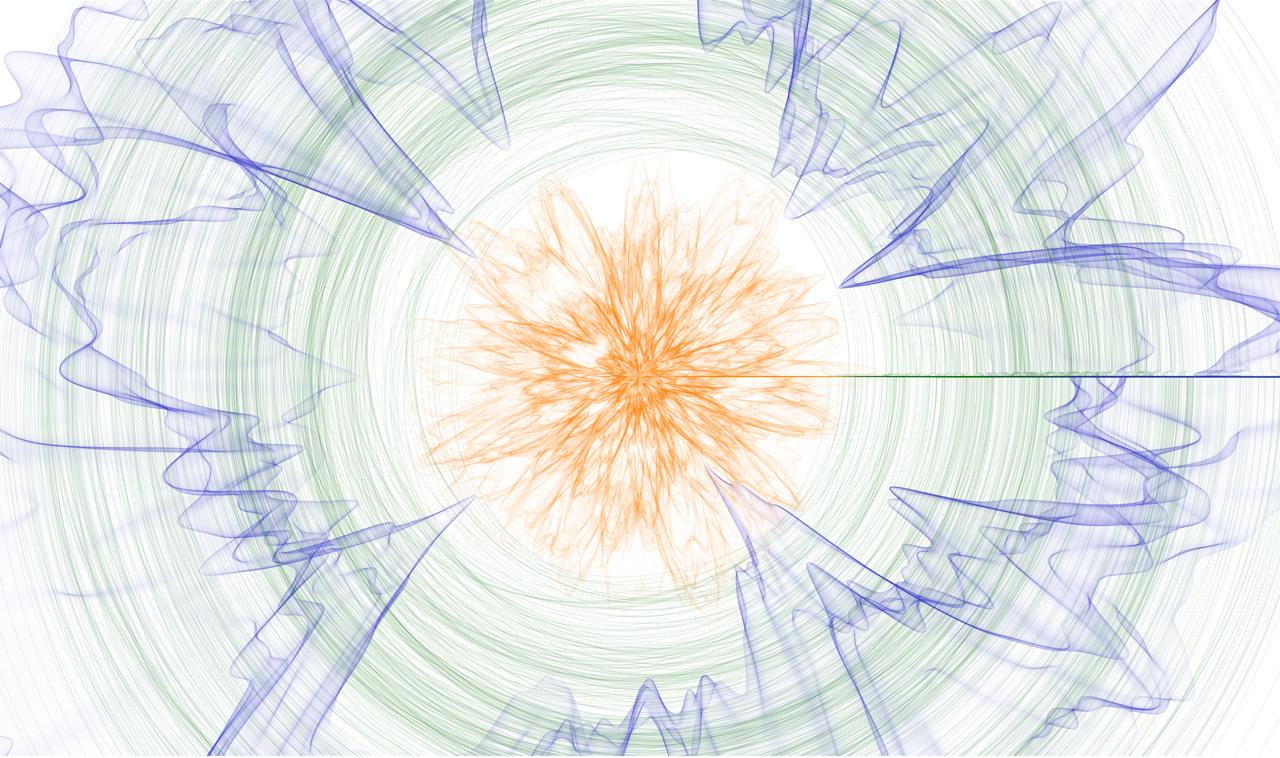
Passing Time
Project Type: Artistic Data Visualization Playform (p5.js)
Background
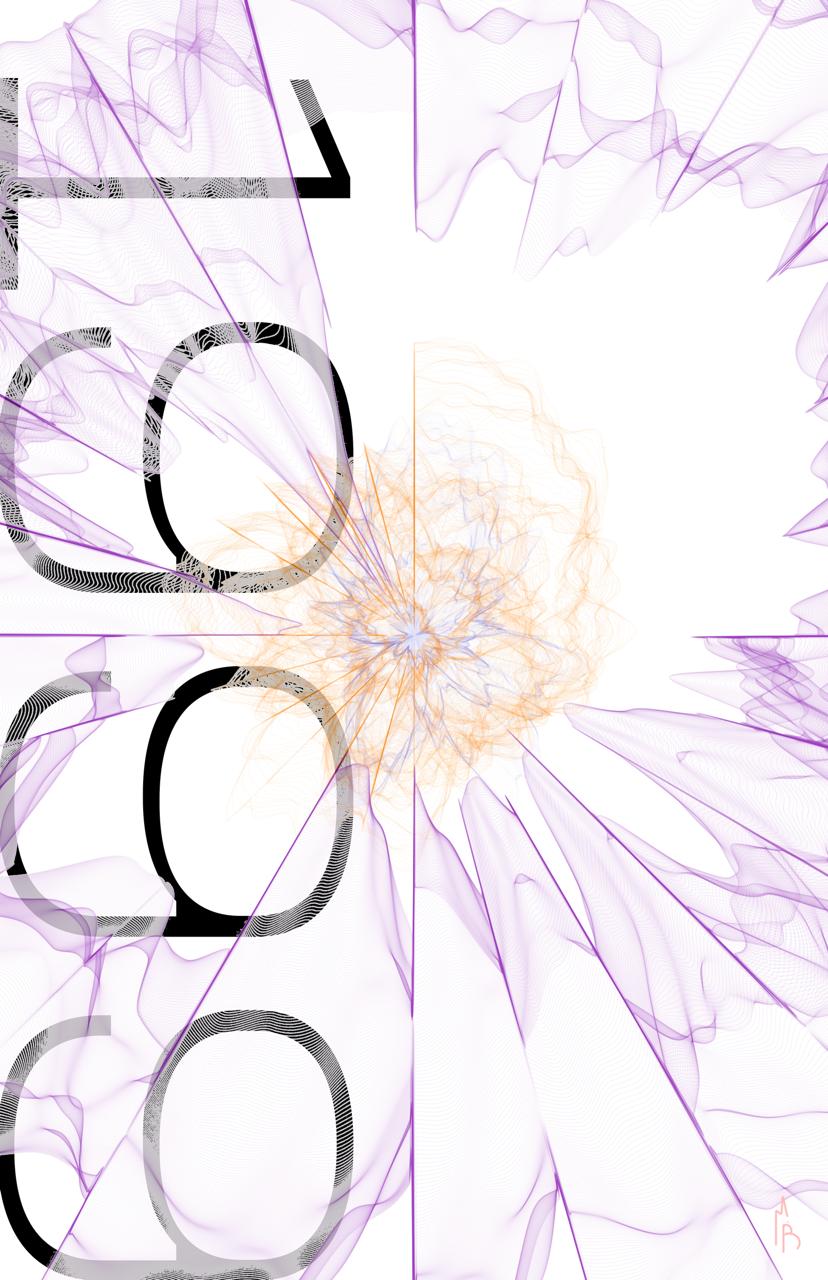
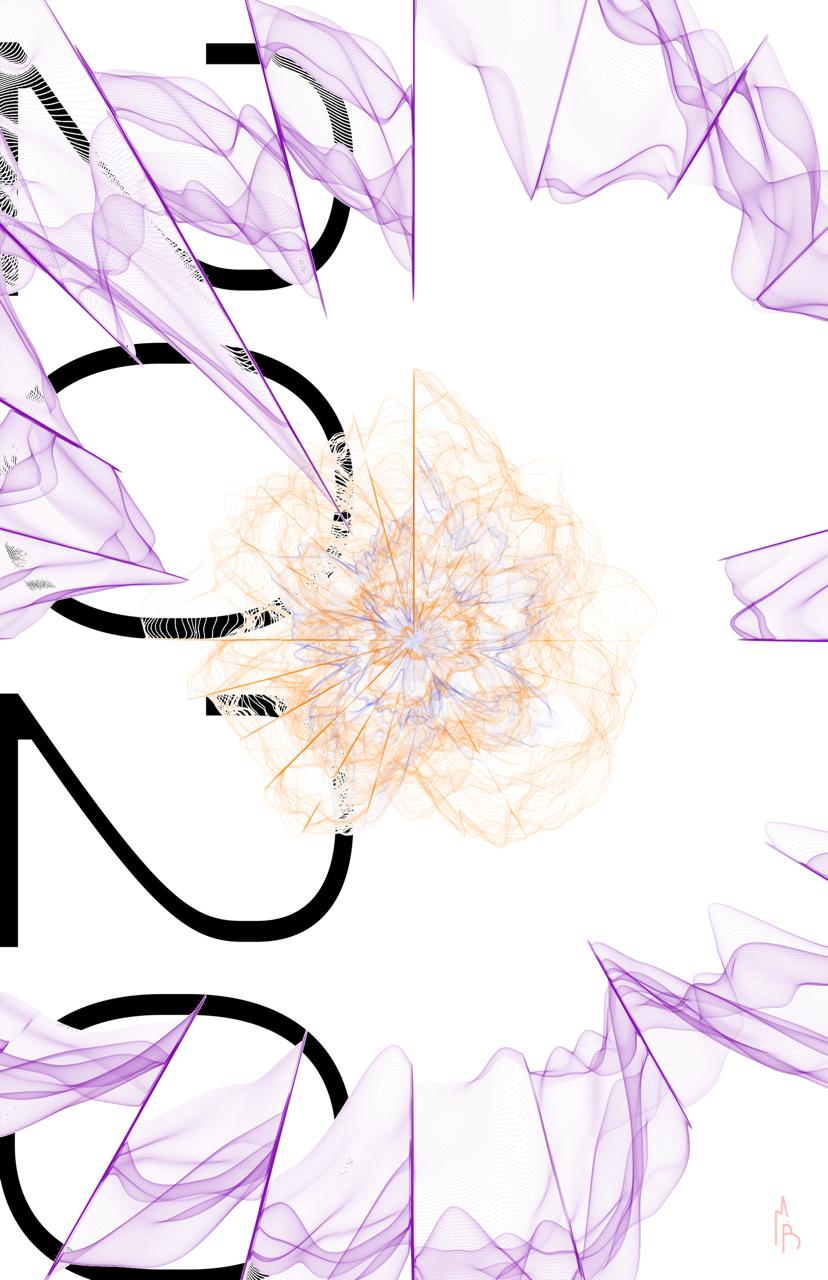
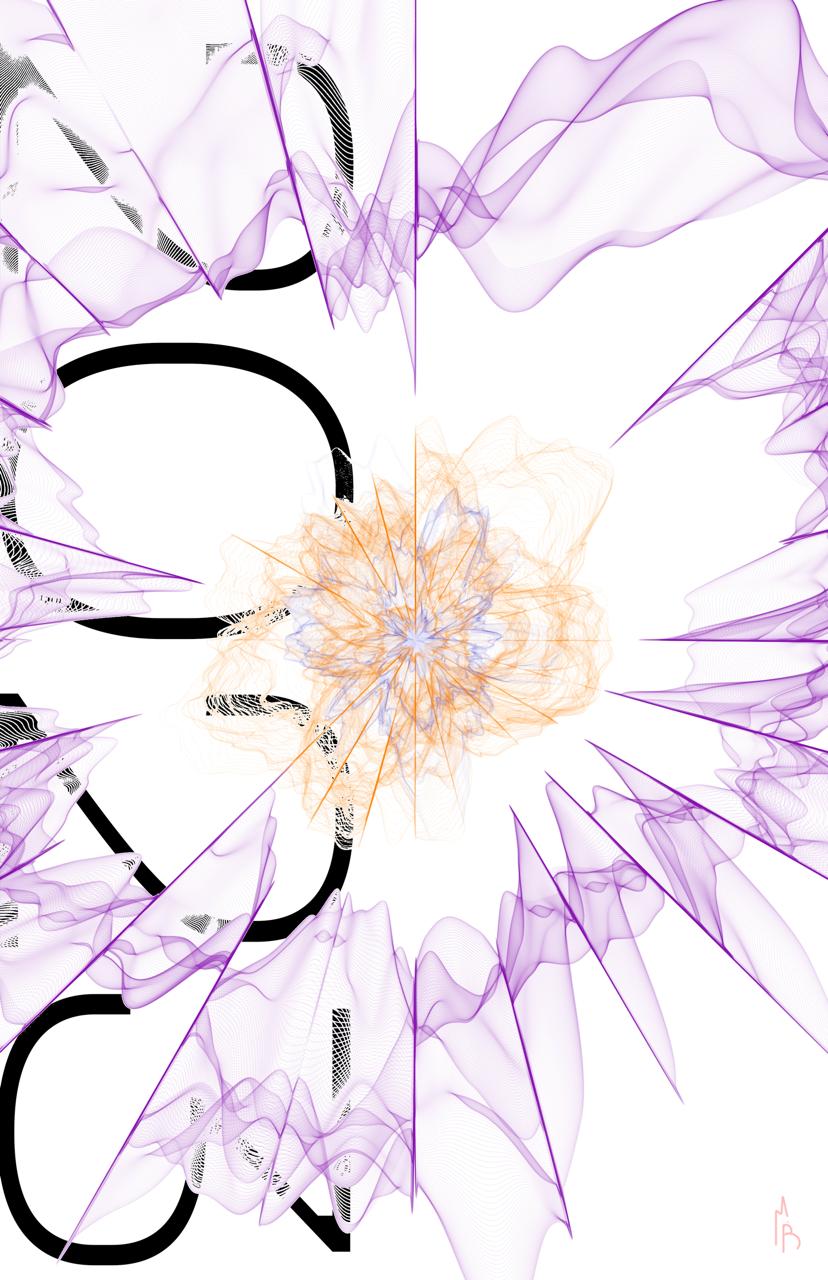
Originally, I had been asked to create a series of artistic visualizations for a friend's birthday. The goal was to use weather data from Sanibel, FL, a city that is important sentimentally important to my friend, and visualize it. Historical weather data for Sanibel's hourly temperature, rain fall, and cloud coverage were collected from November 1999 to November 2024.
Due to the large amount of collected data, a series of visualizations were created. Each visualization represents 365 days of a year over the course of a 24 hour day. Using the built-in noise functionality from p5.js, the weather data and other iterative parameters to plot points and create organic shapes in the page. The system for generating the organic forms has also been abstracted to create visualizations based on any langitude and longitude. The resulting visualizations can also be used throughout different mediums such as posters, animations, or still graphic elements.
Team
- Matt Blanco - Designer
- Silvia Gosalvez - Art Advisor
2000
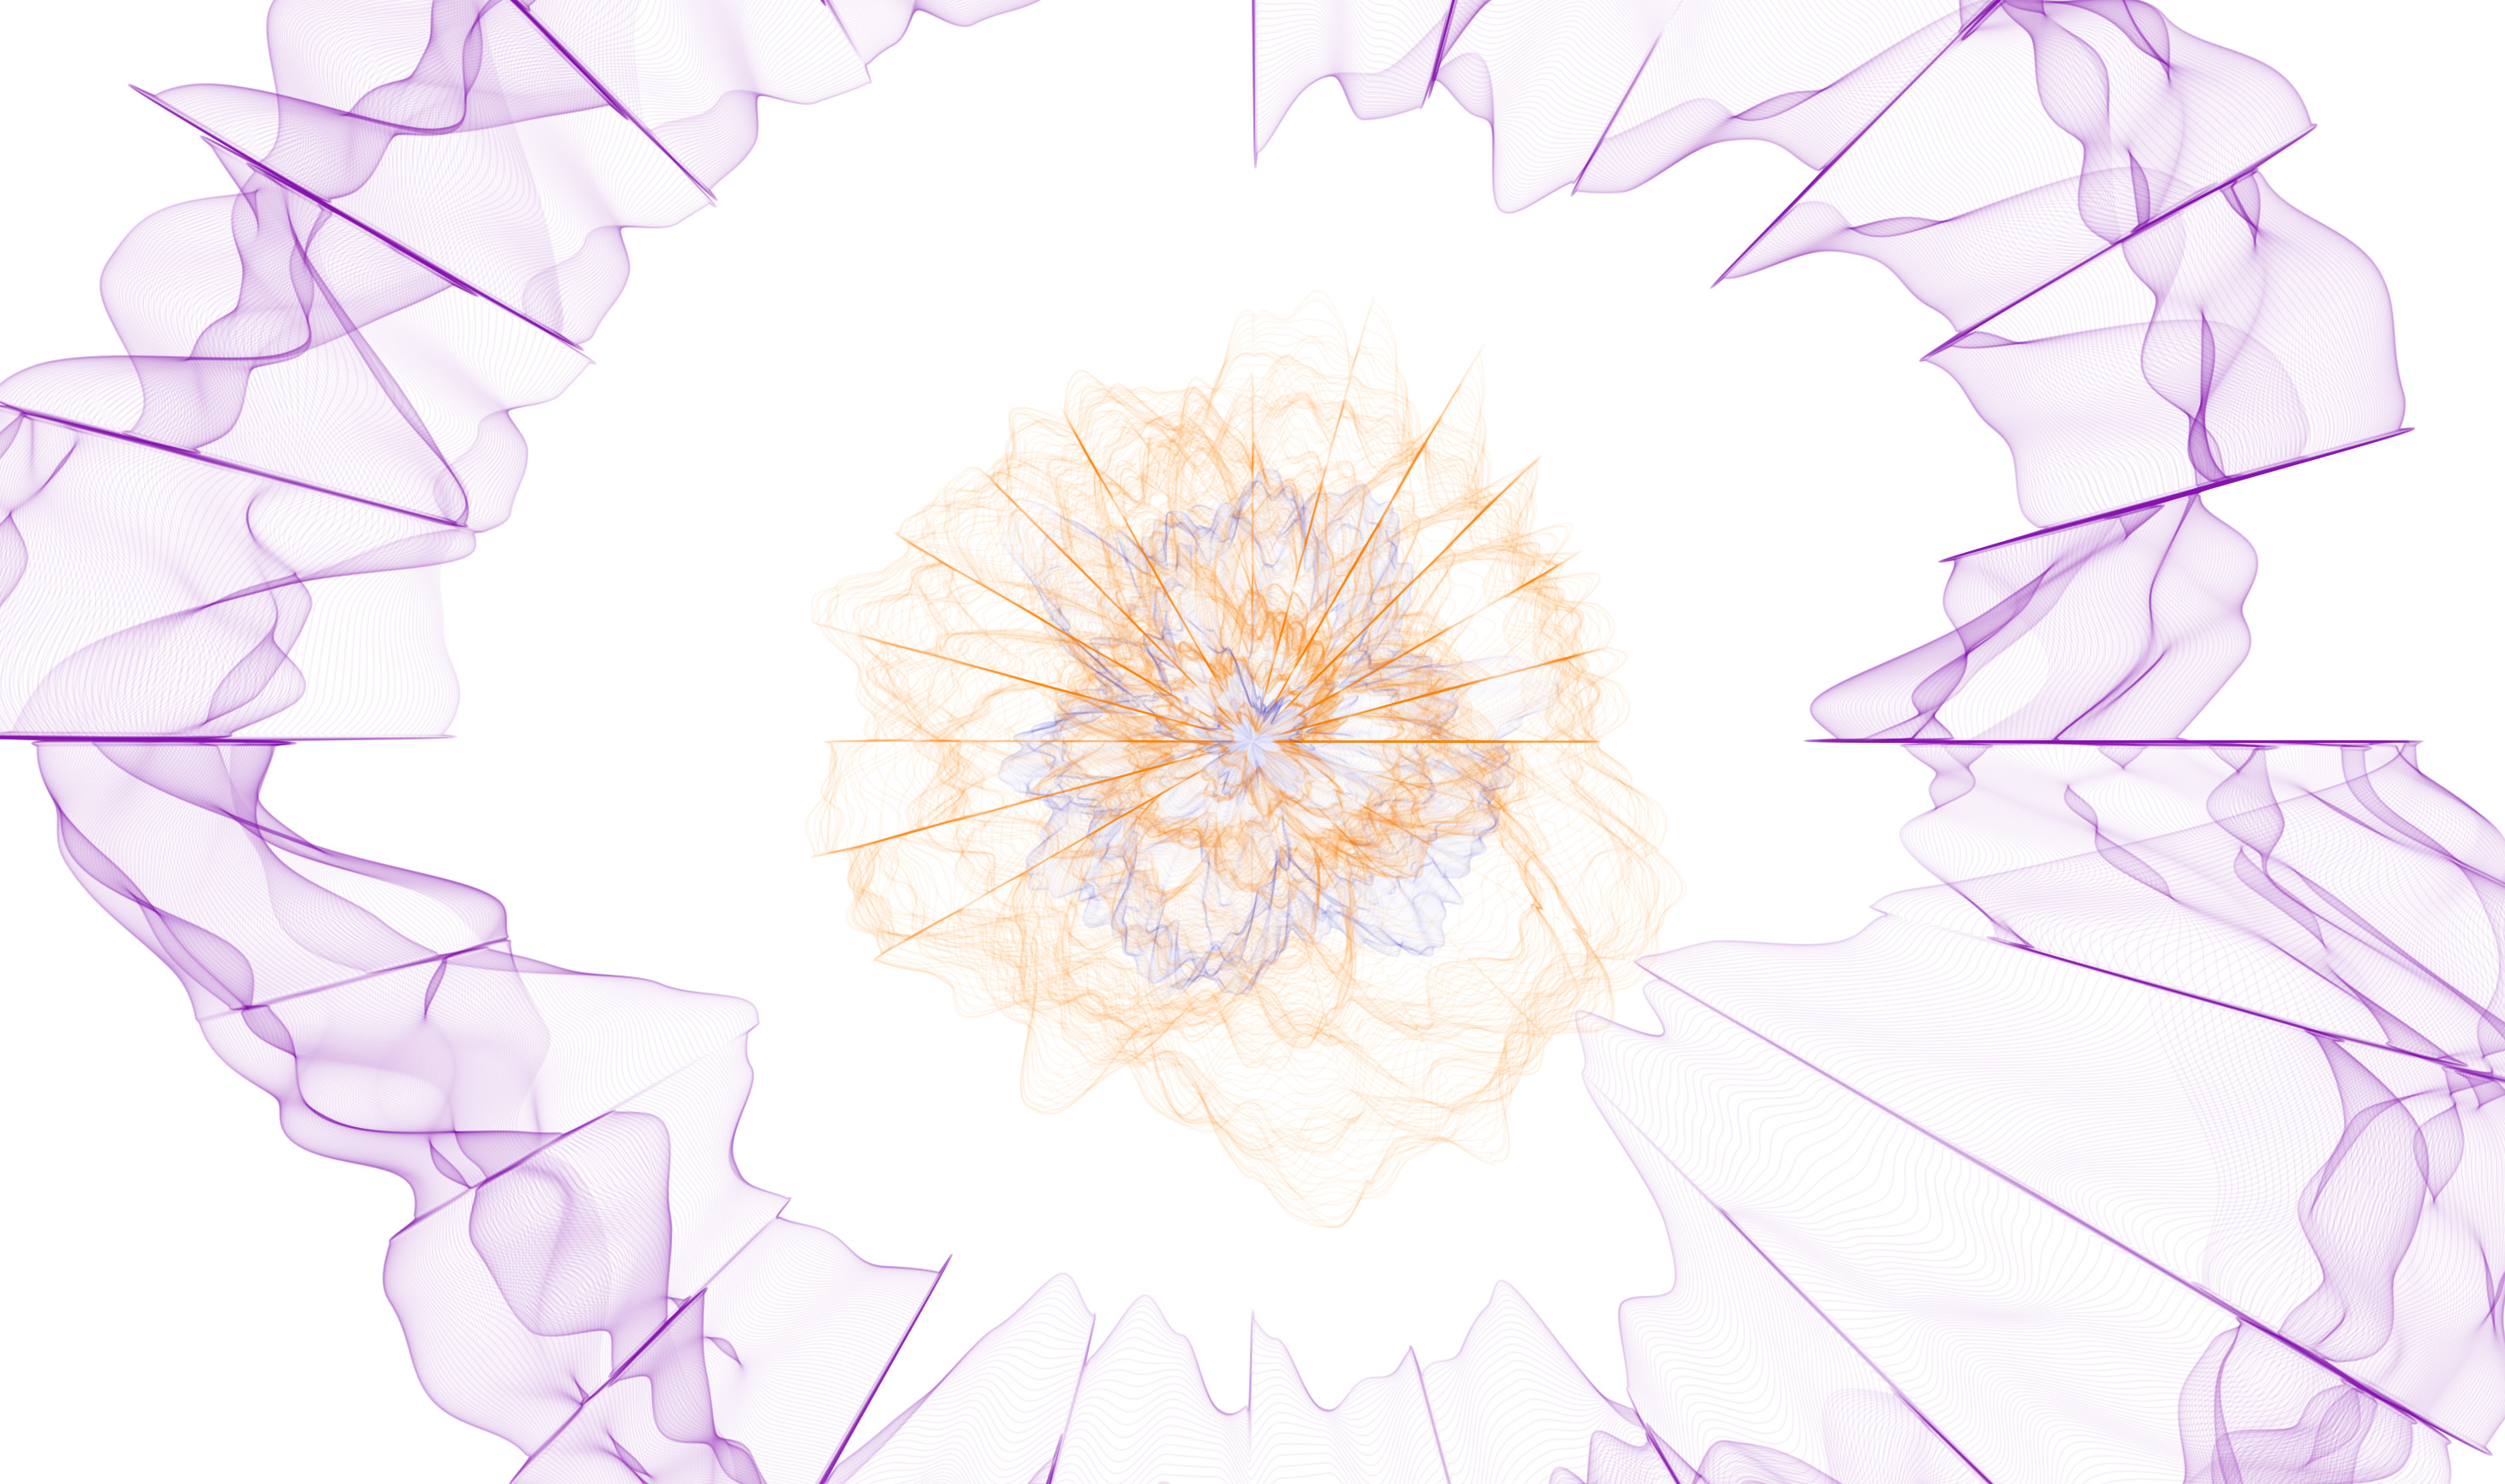
2001
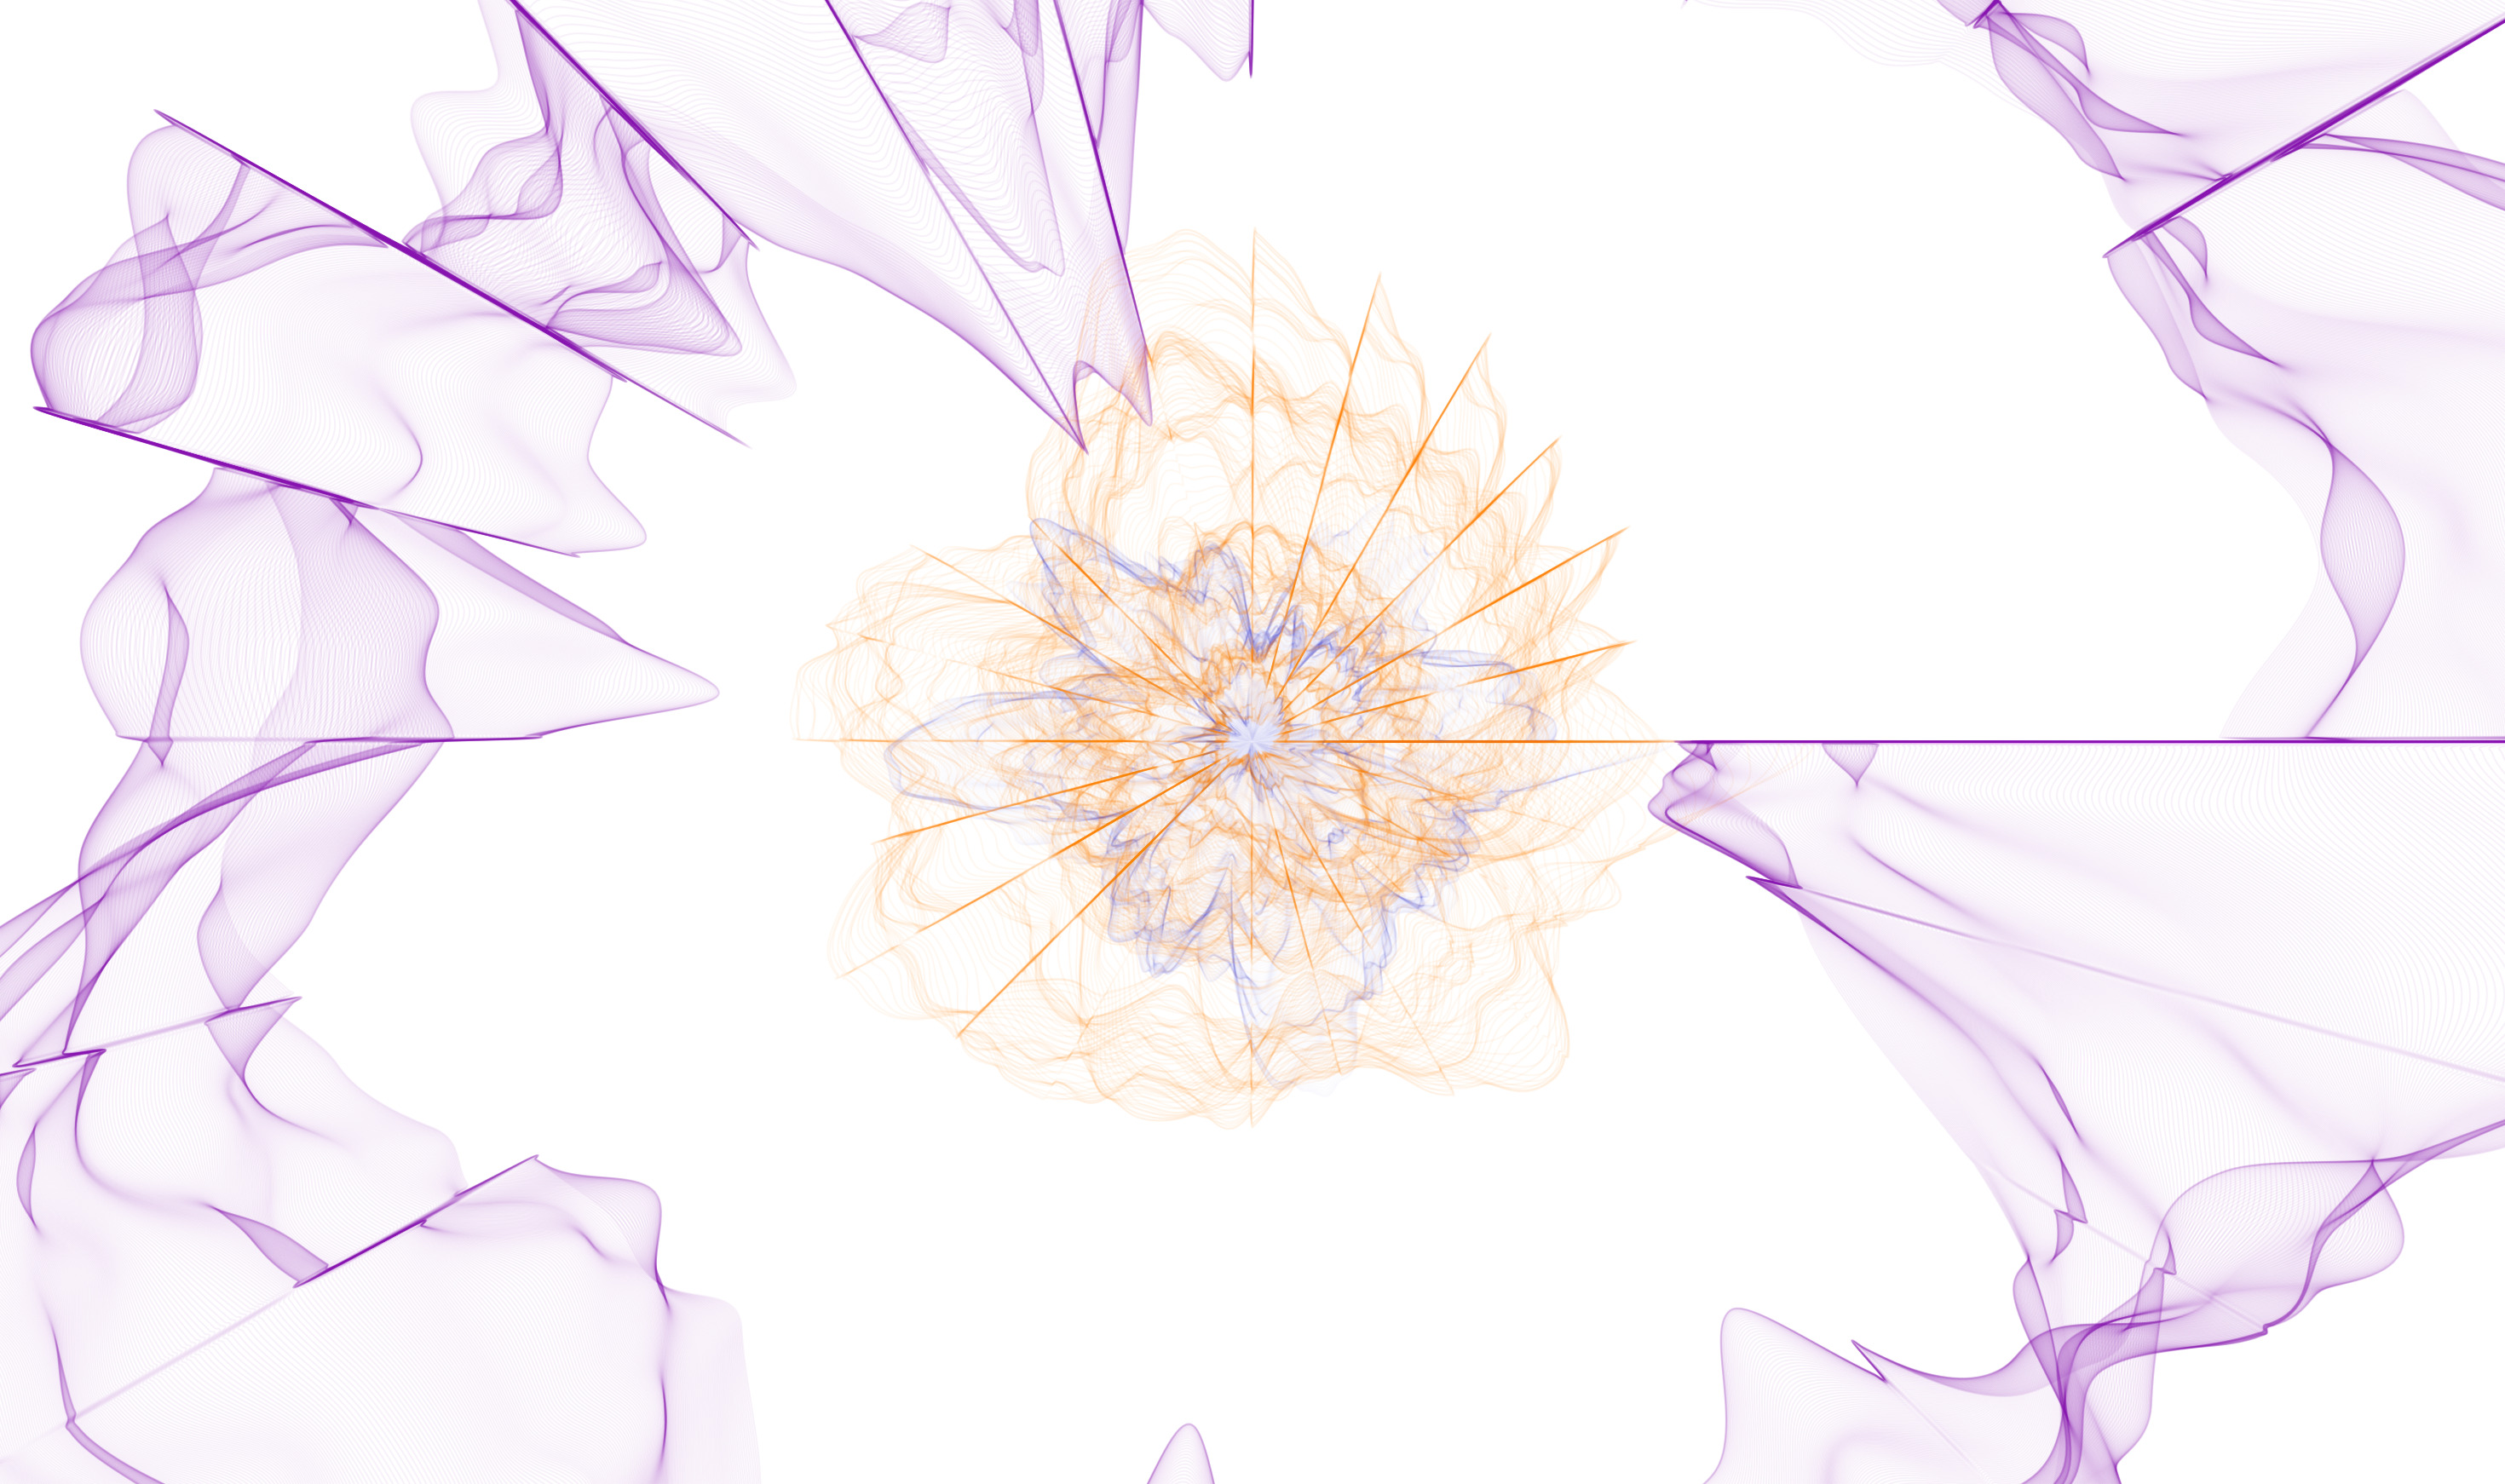
2002
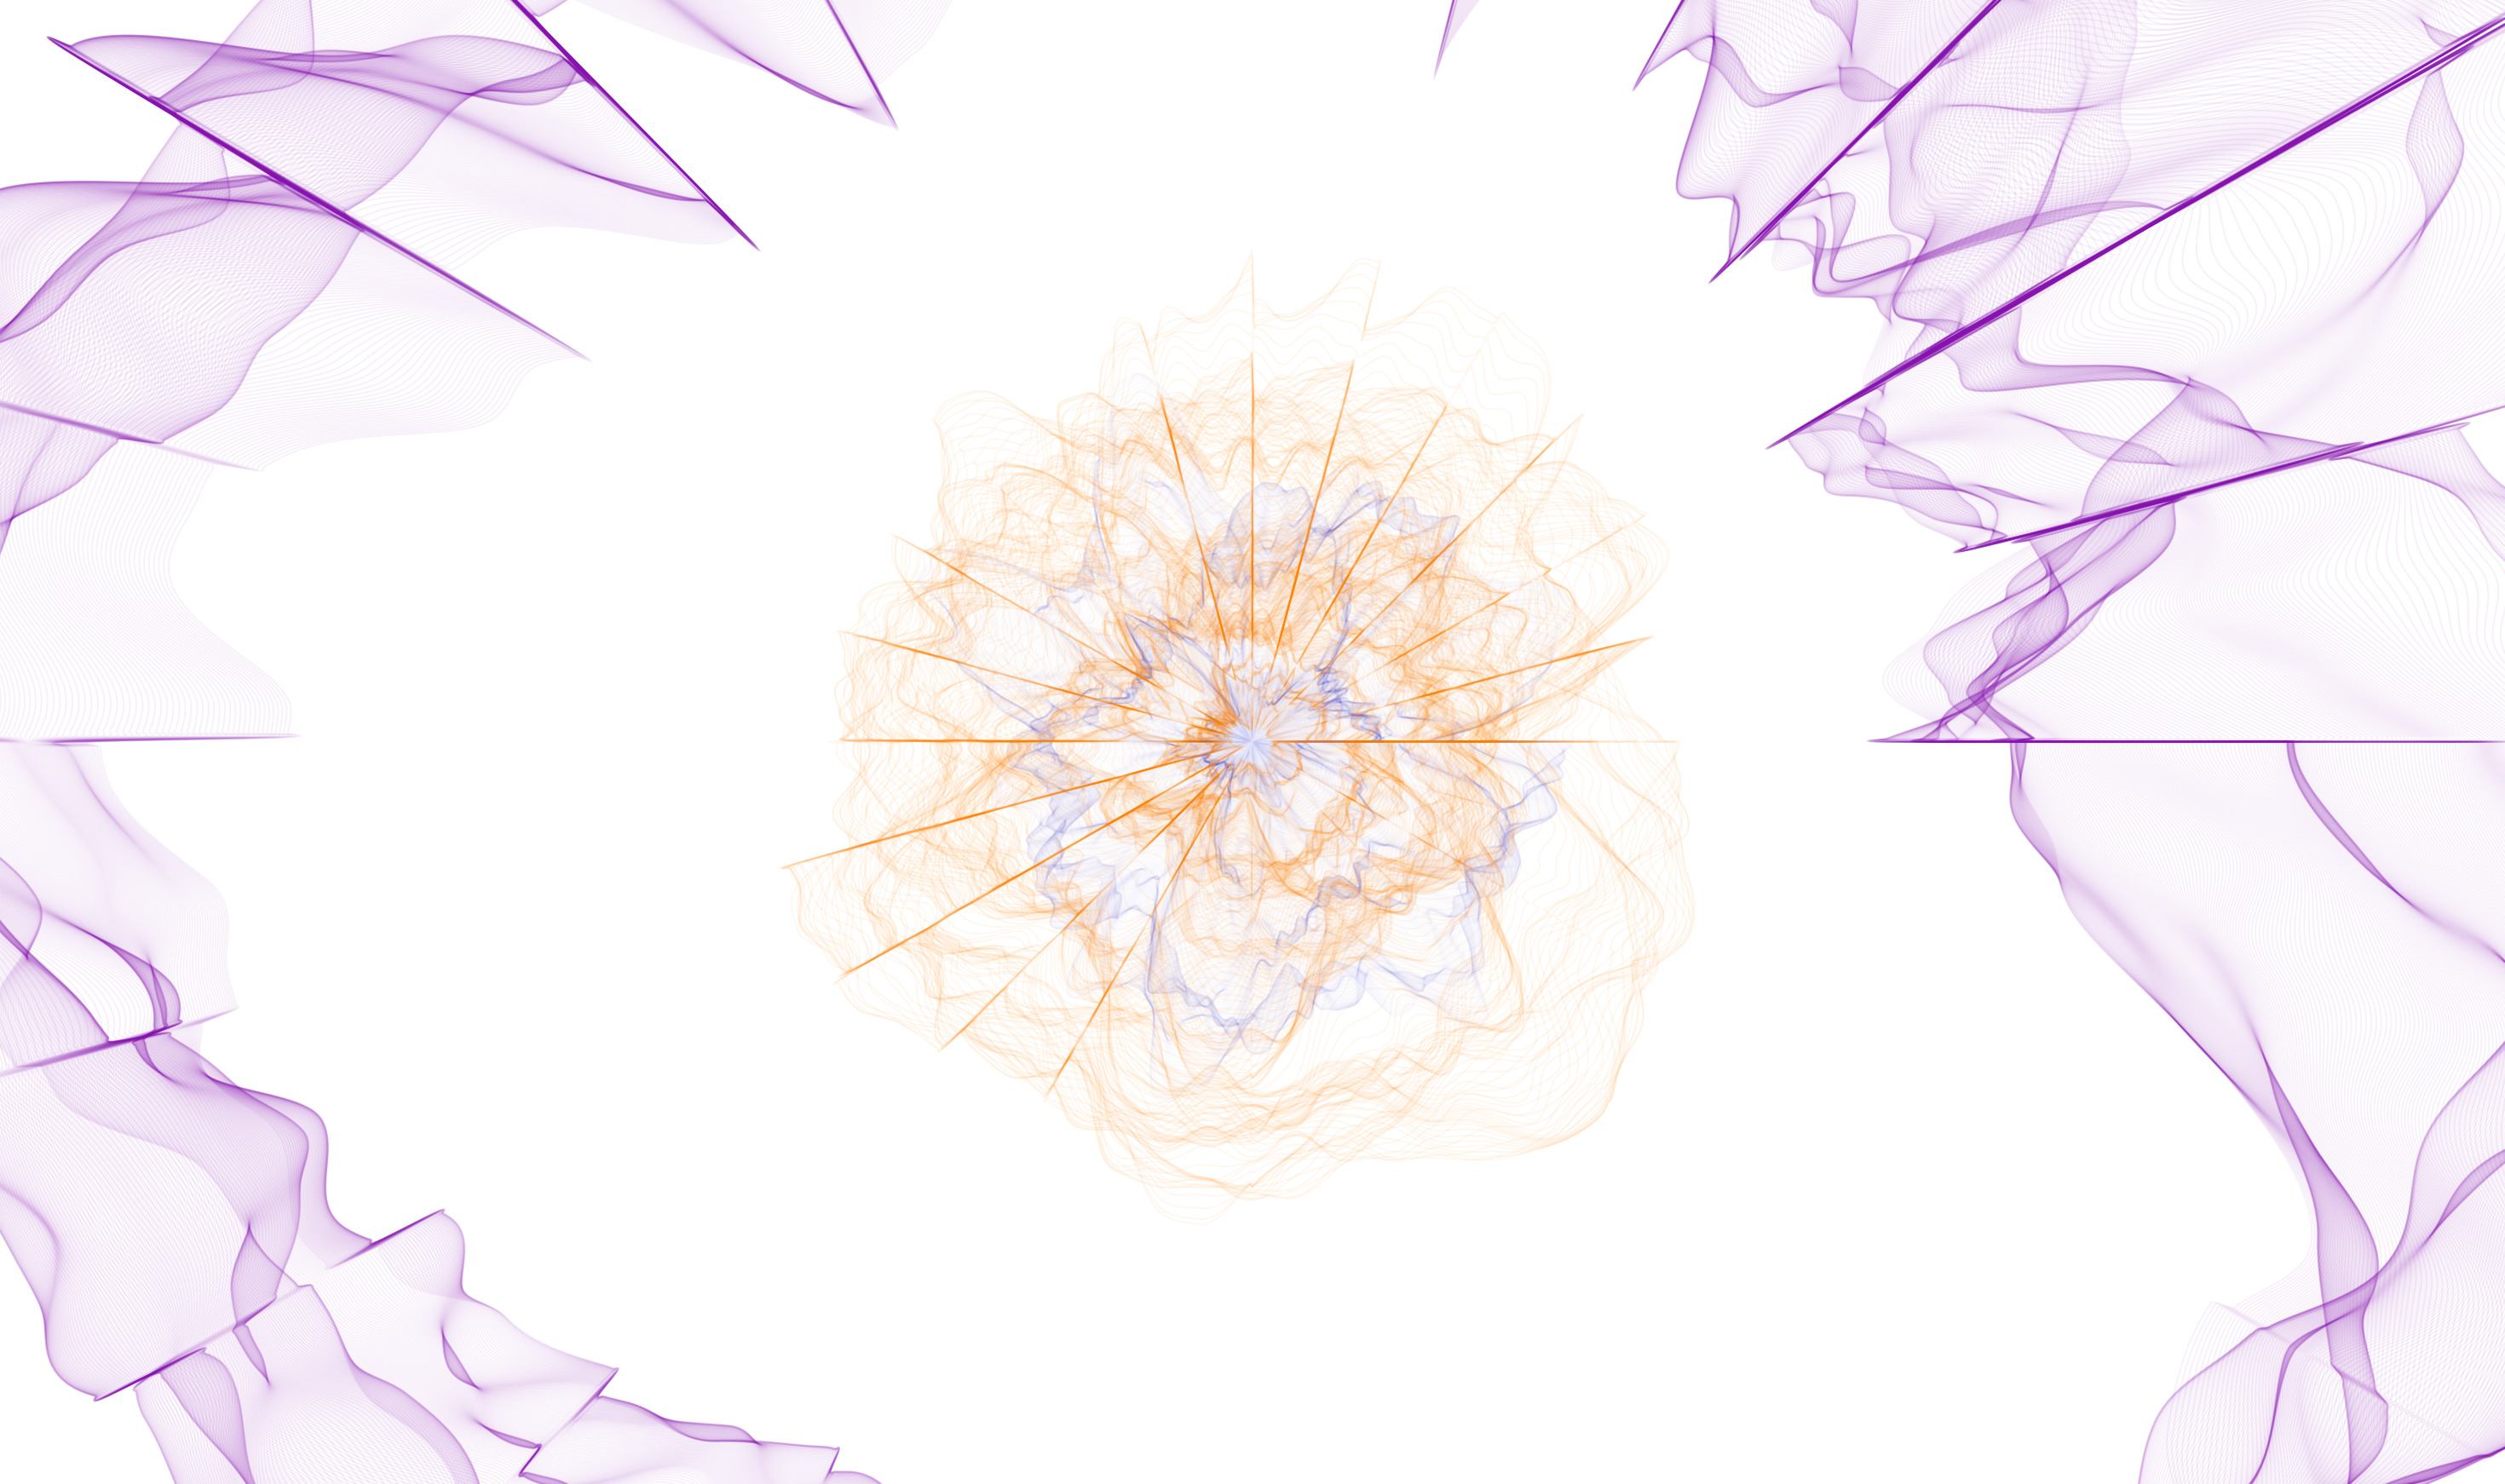
2003
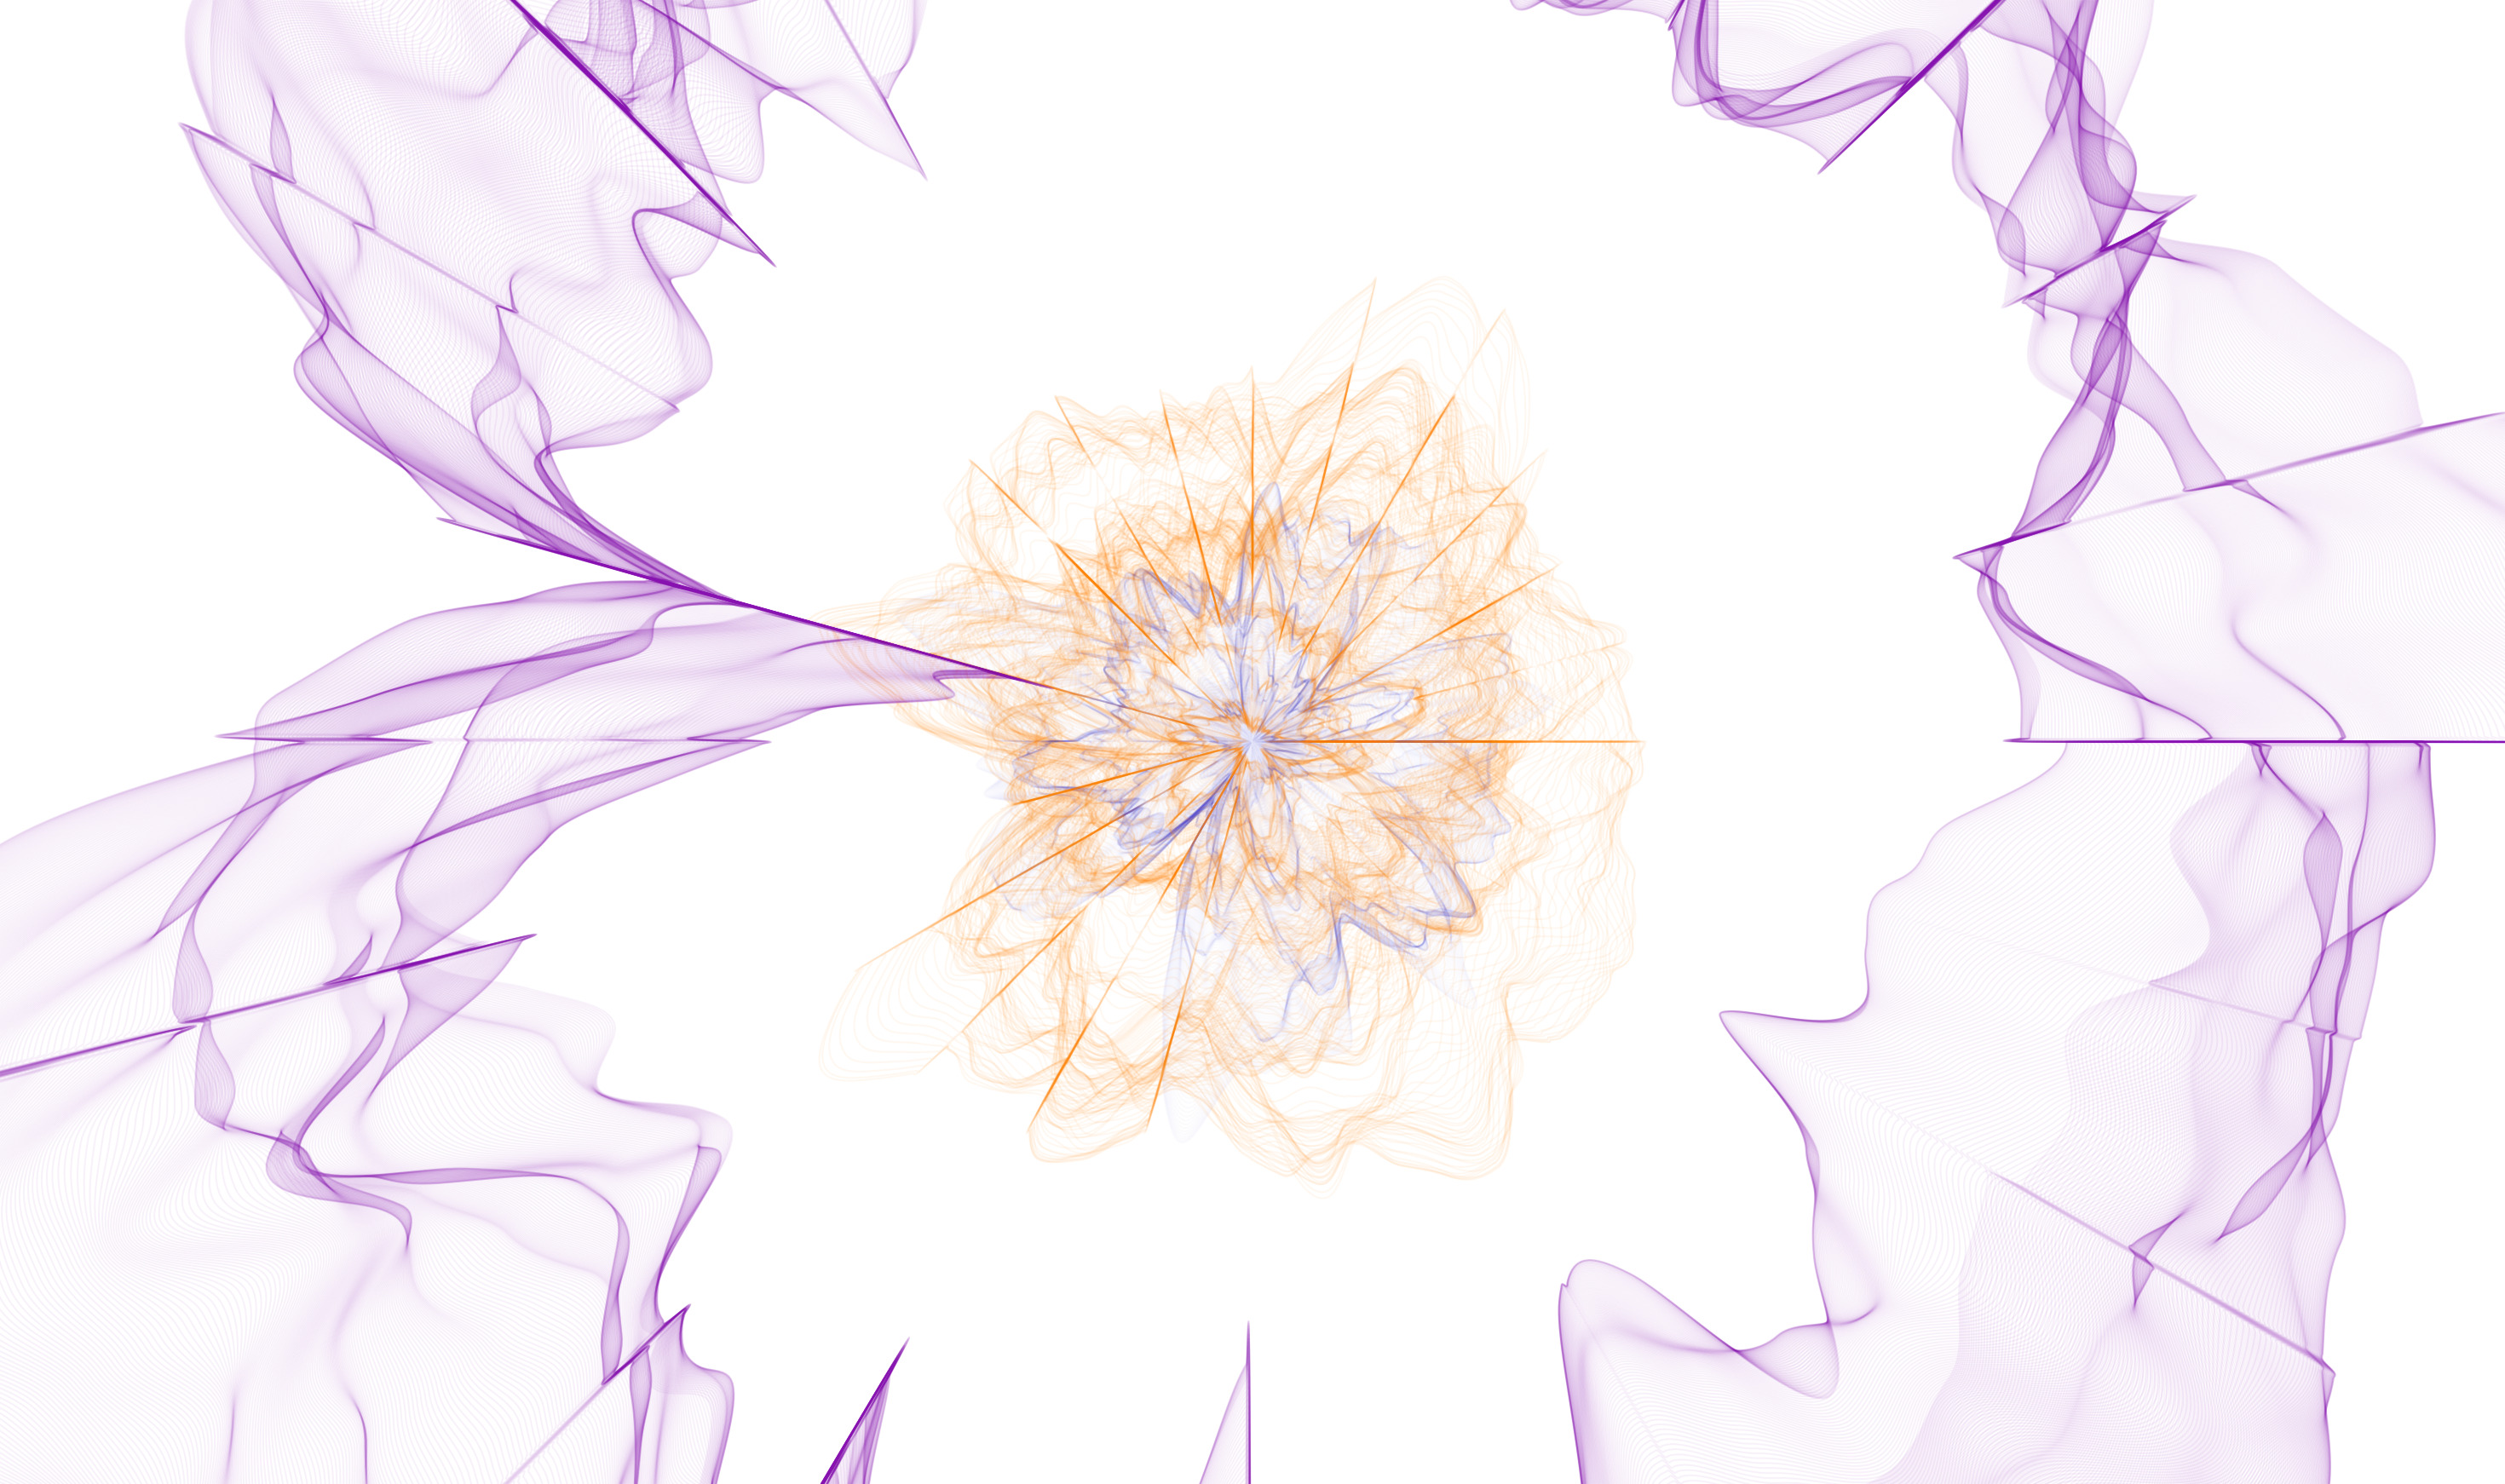
2004
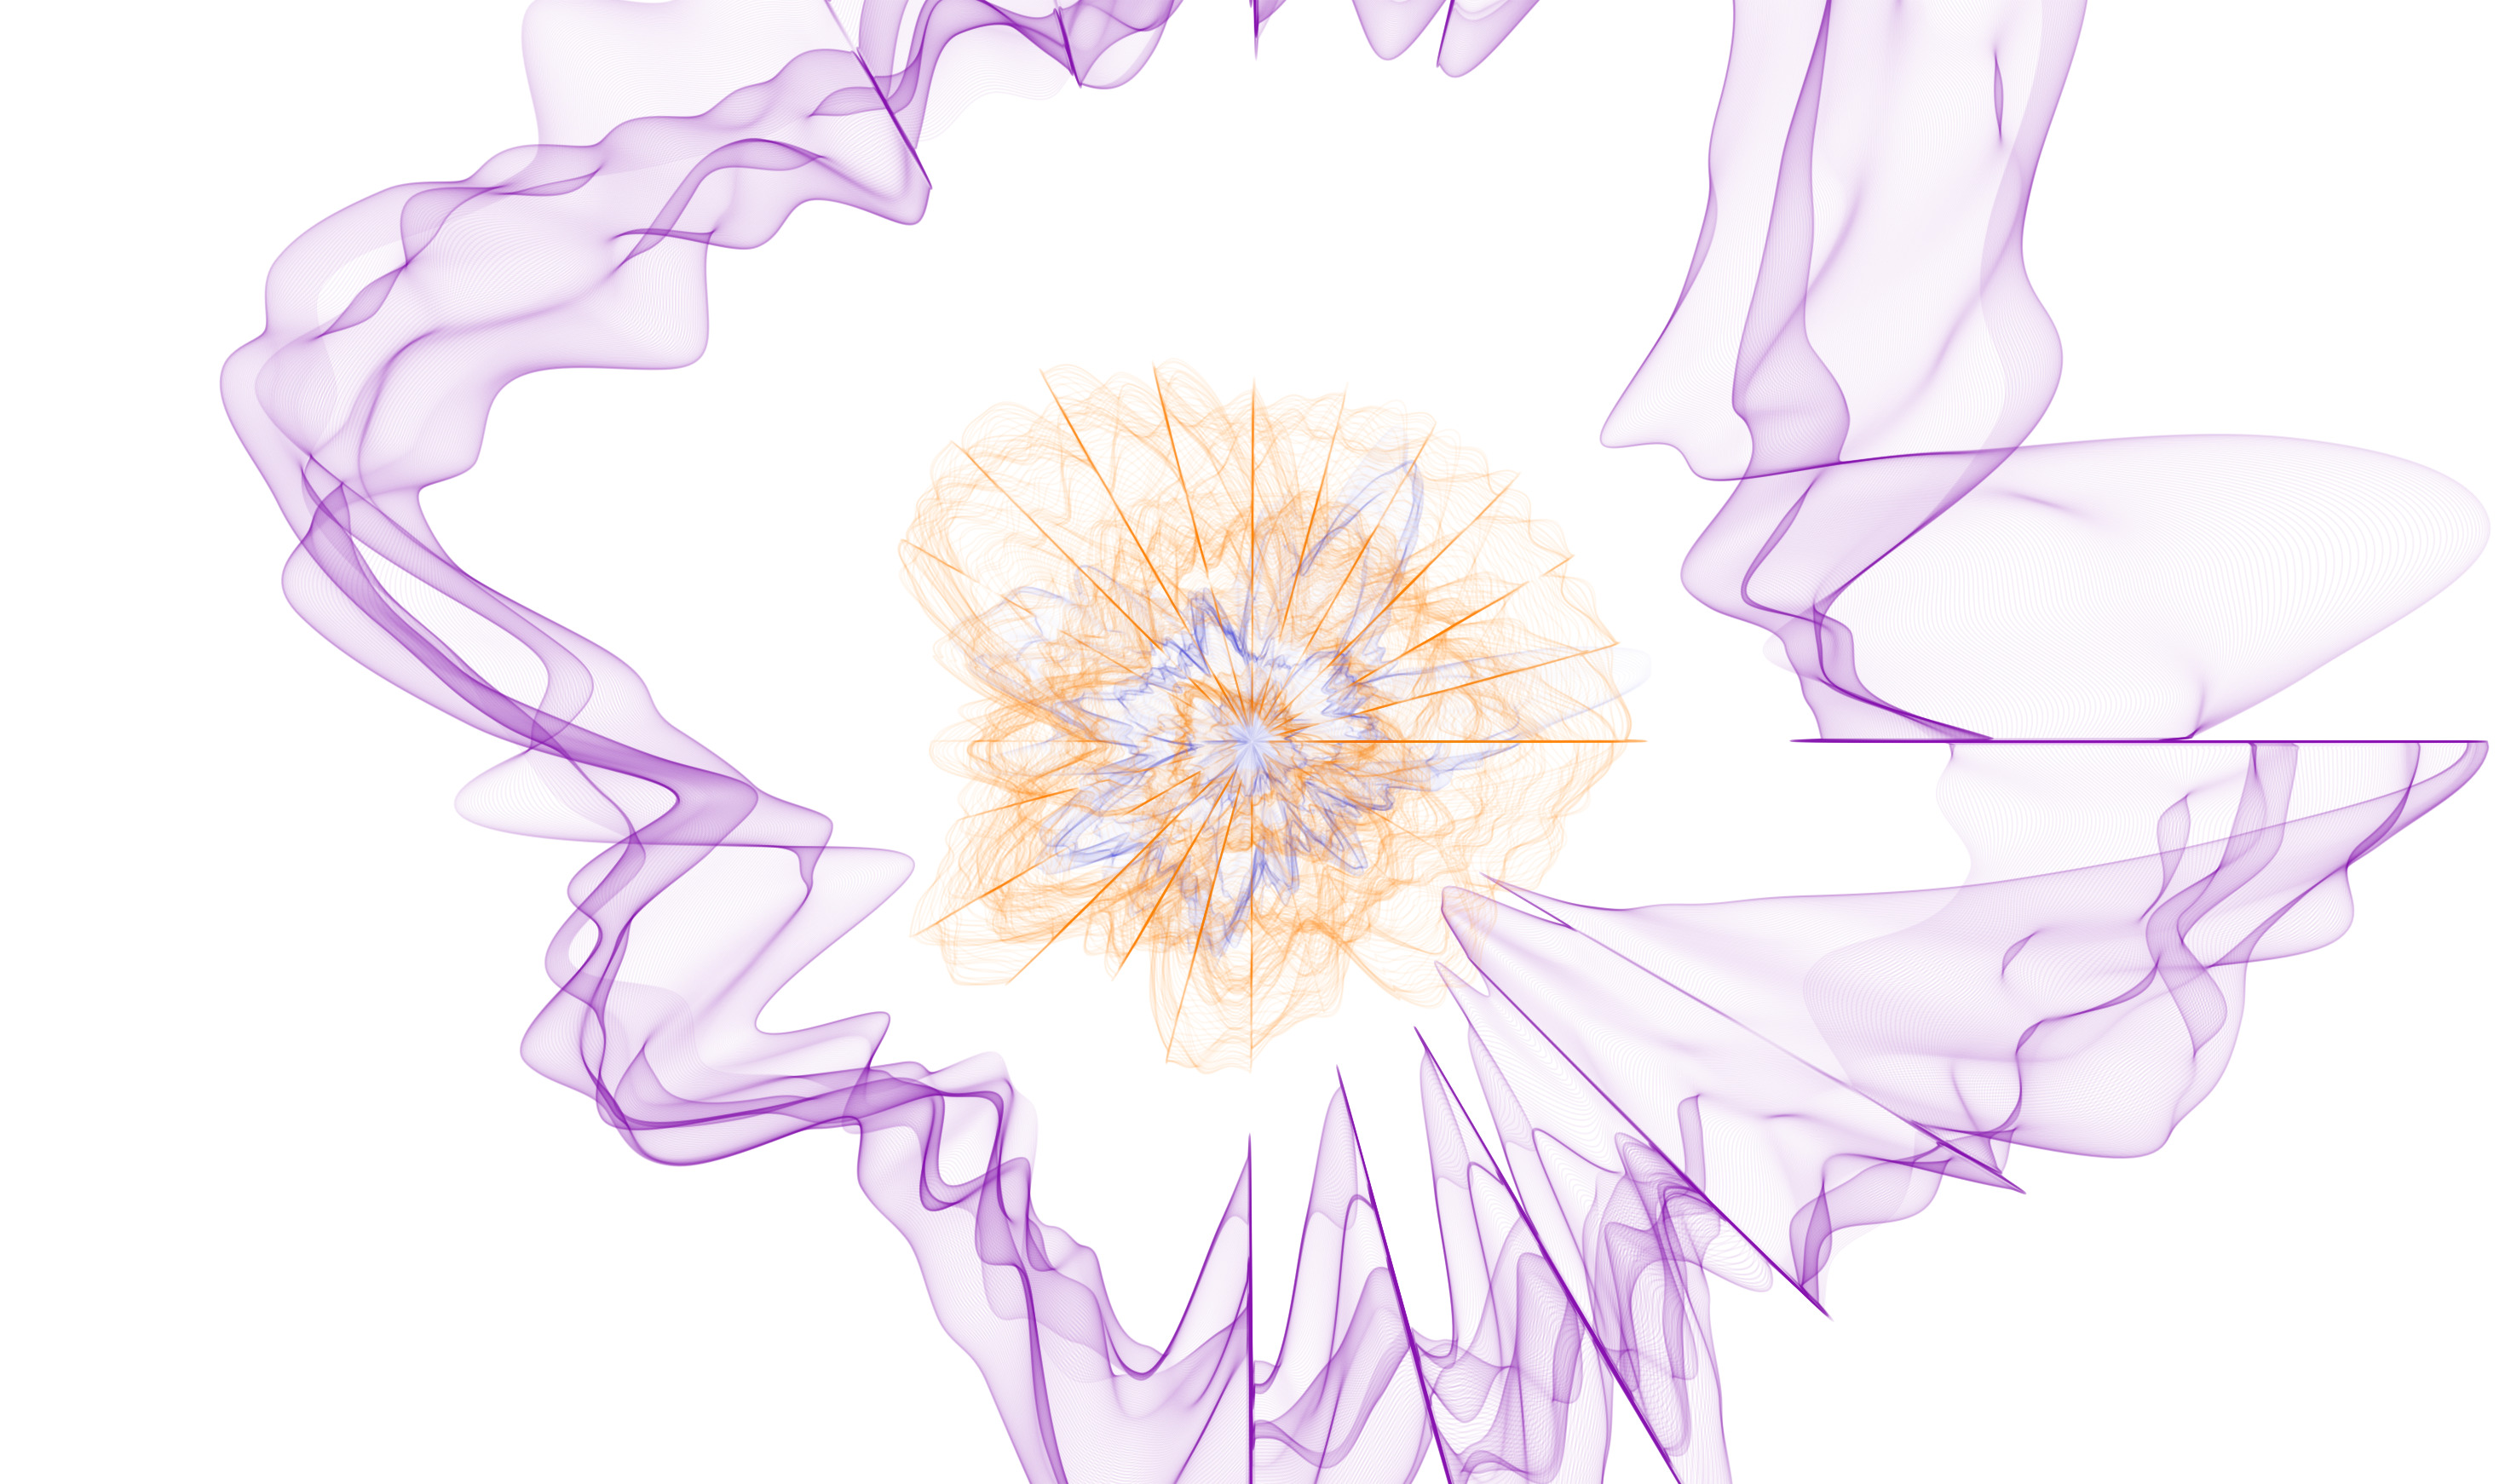
2005
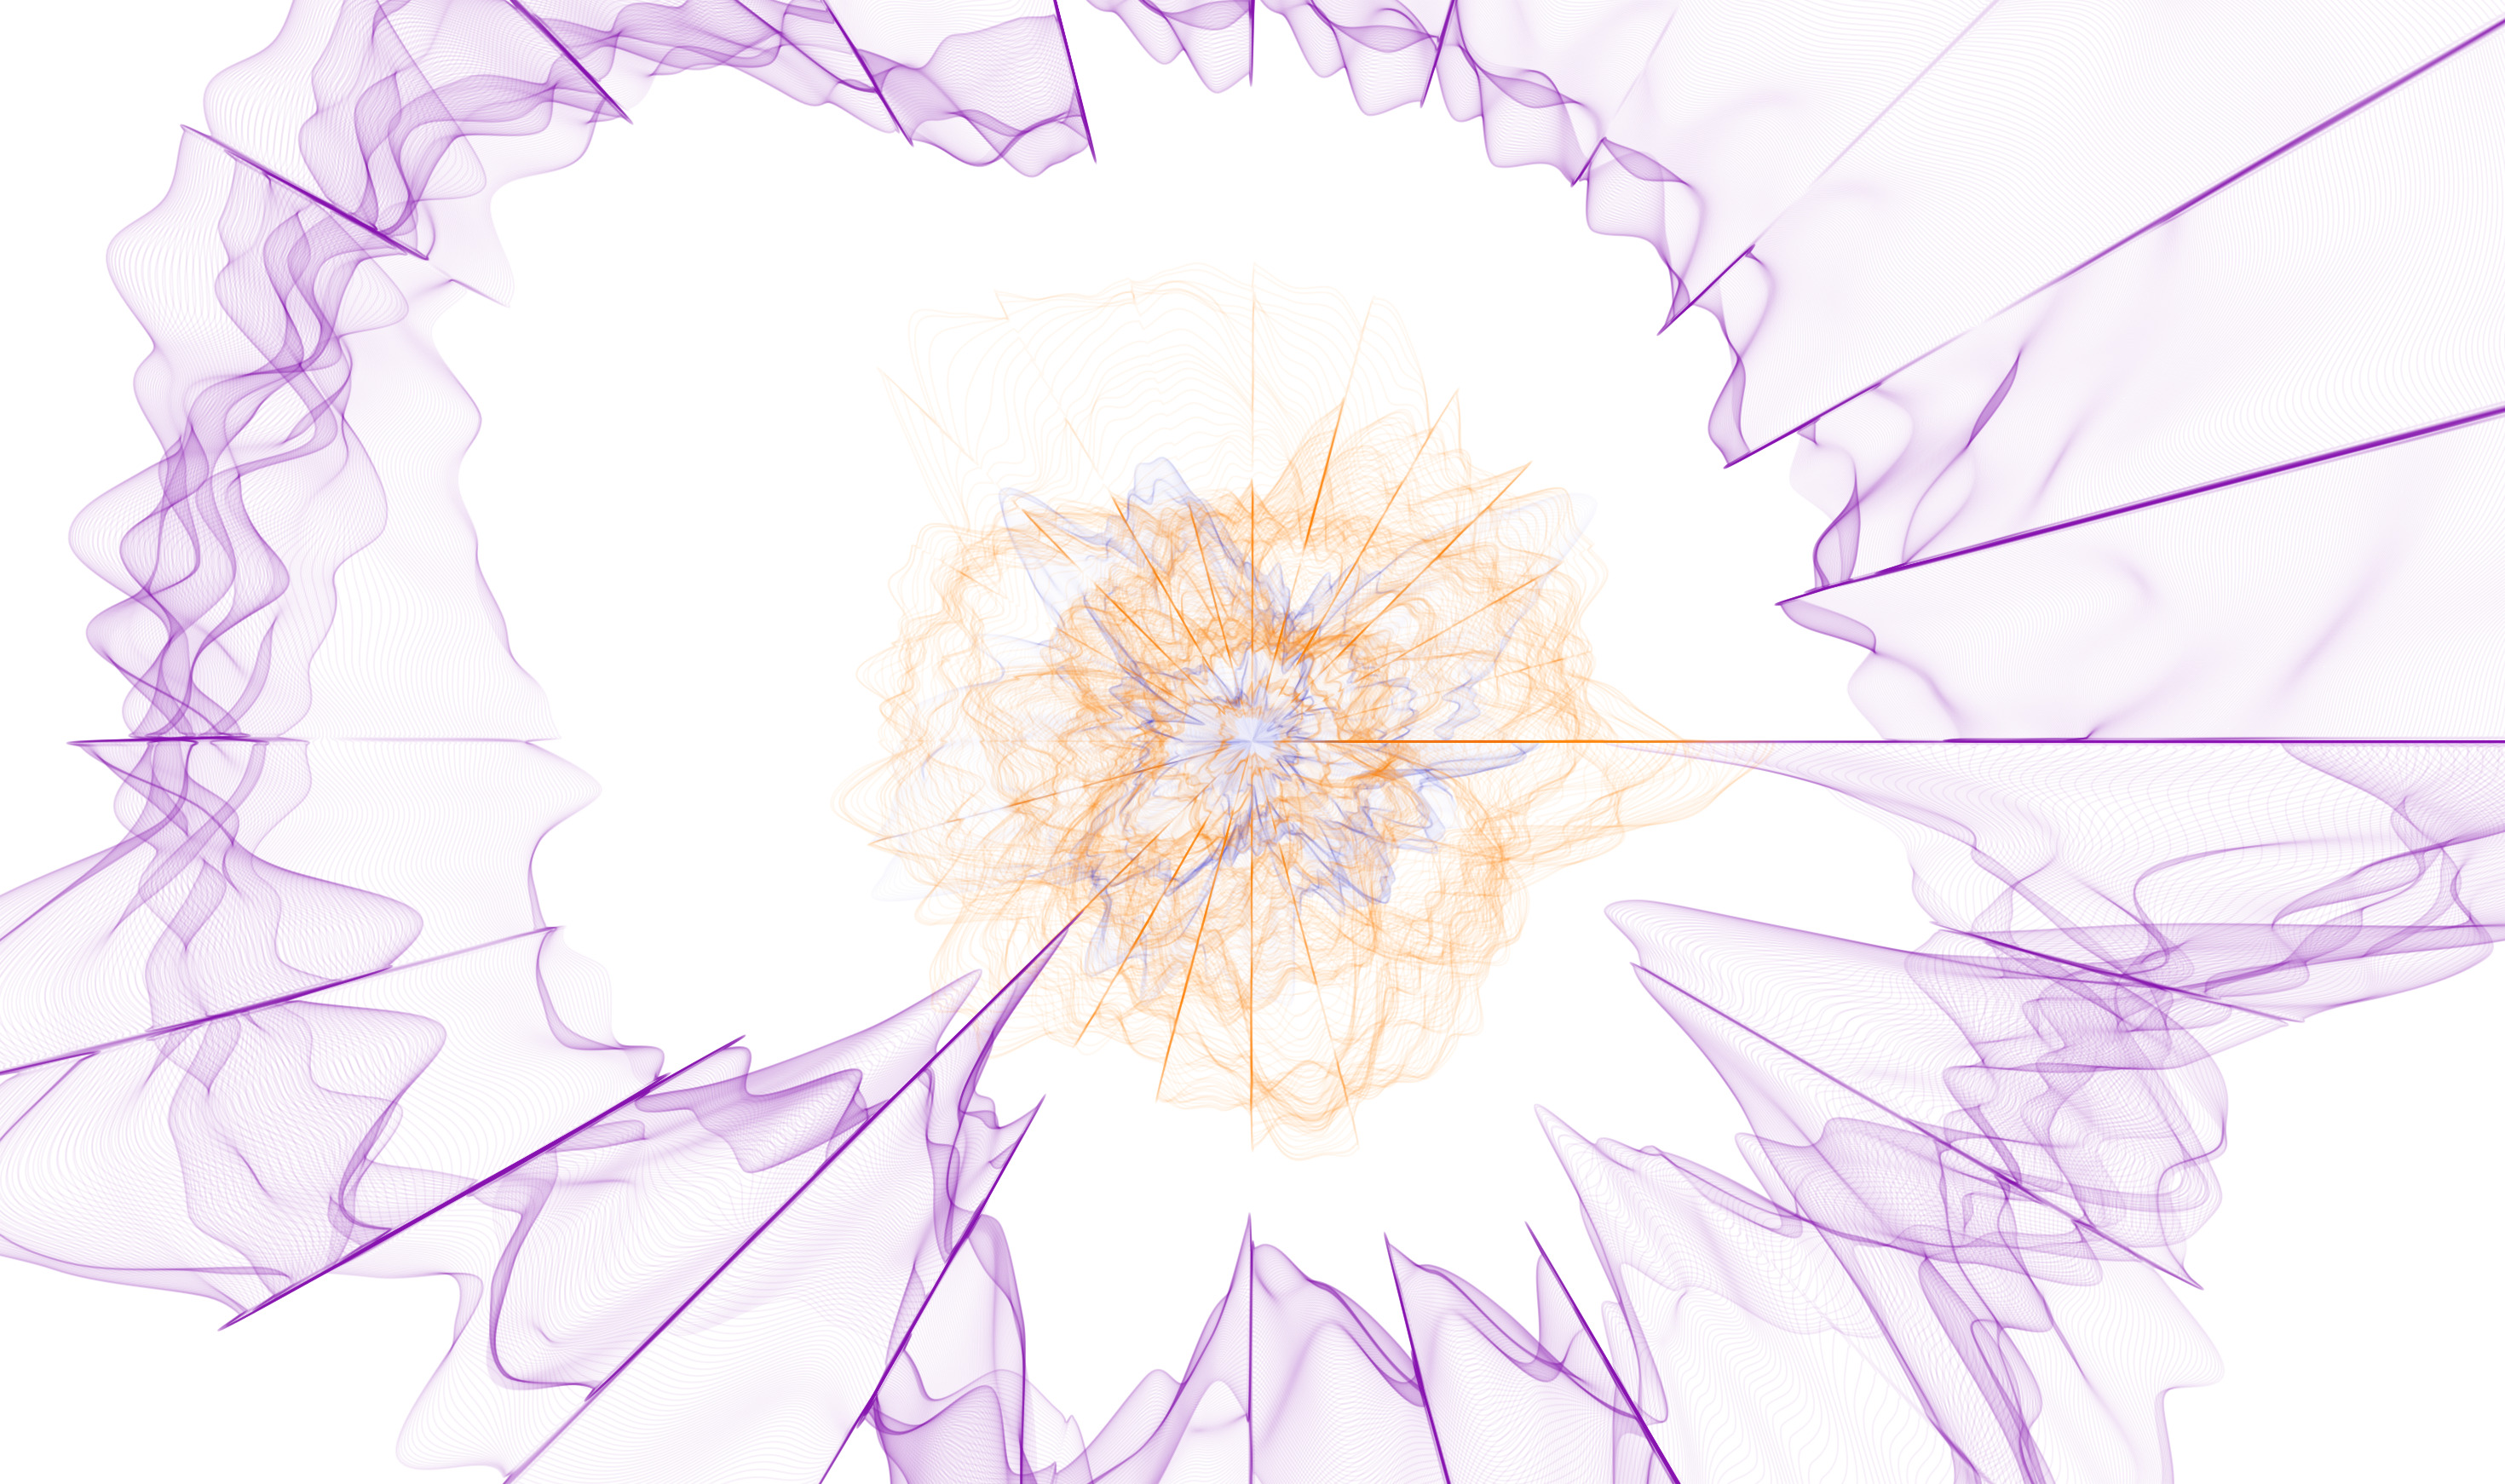
2006
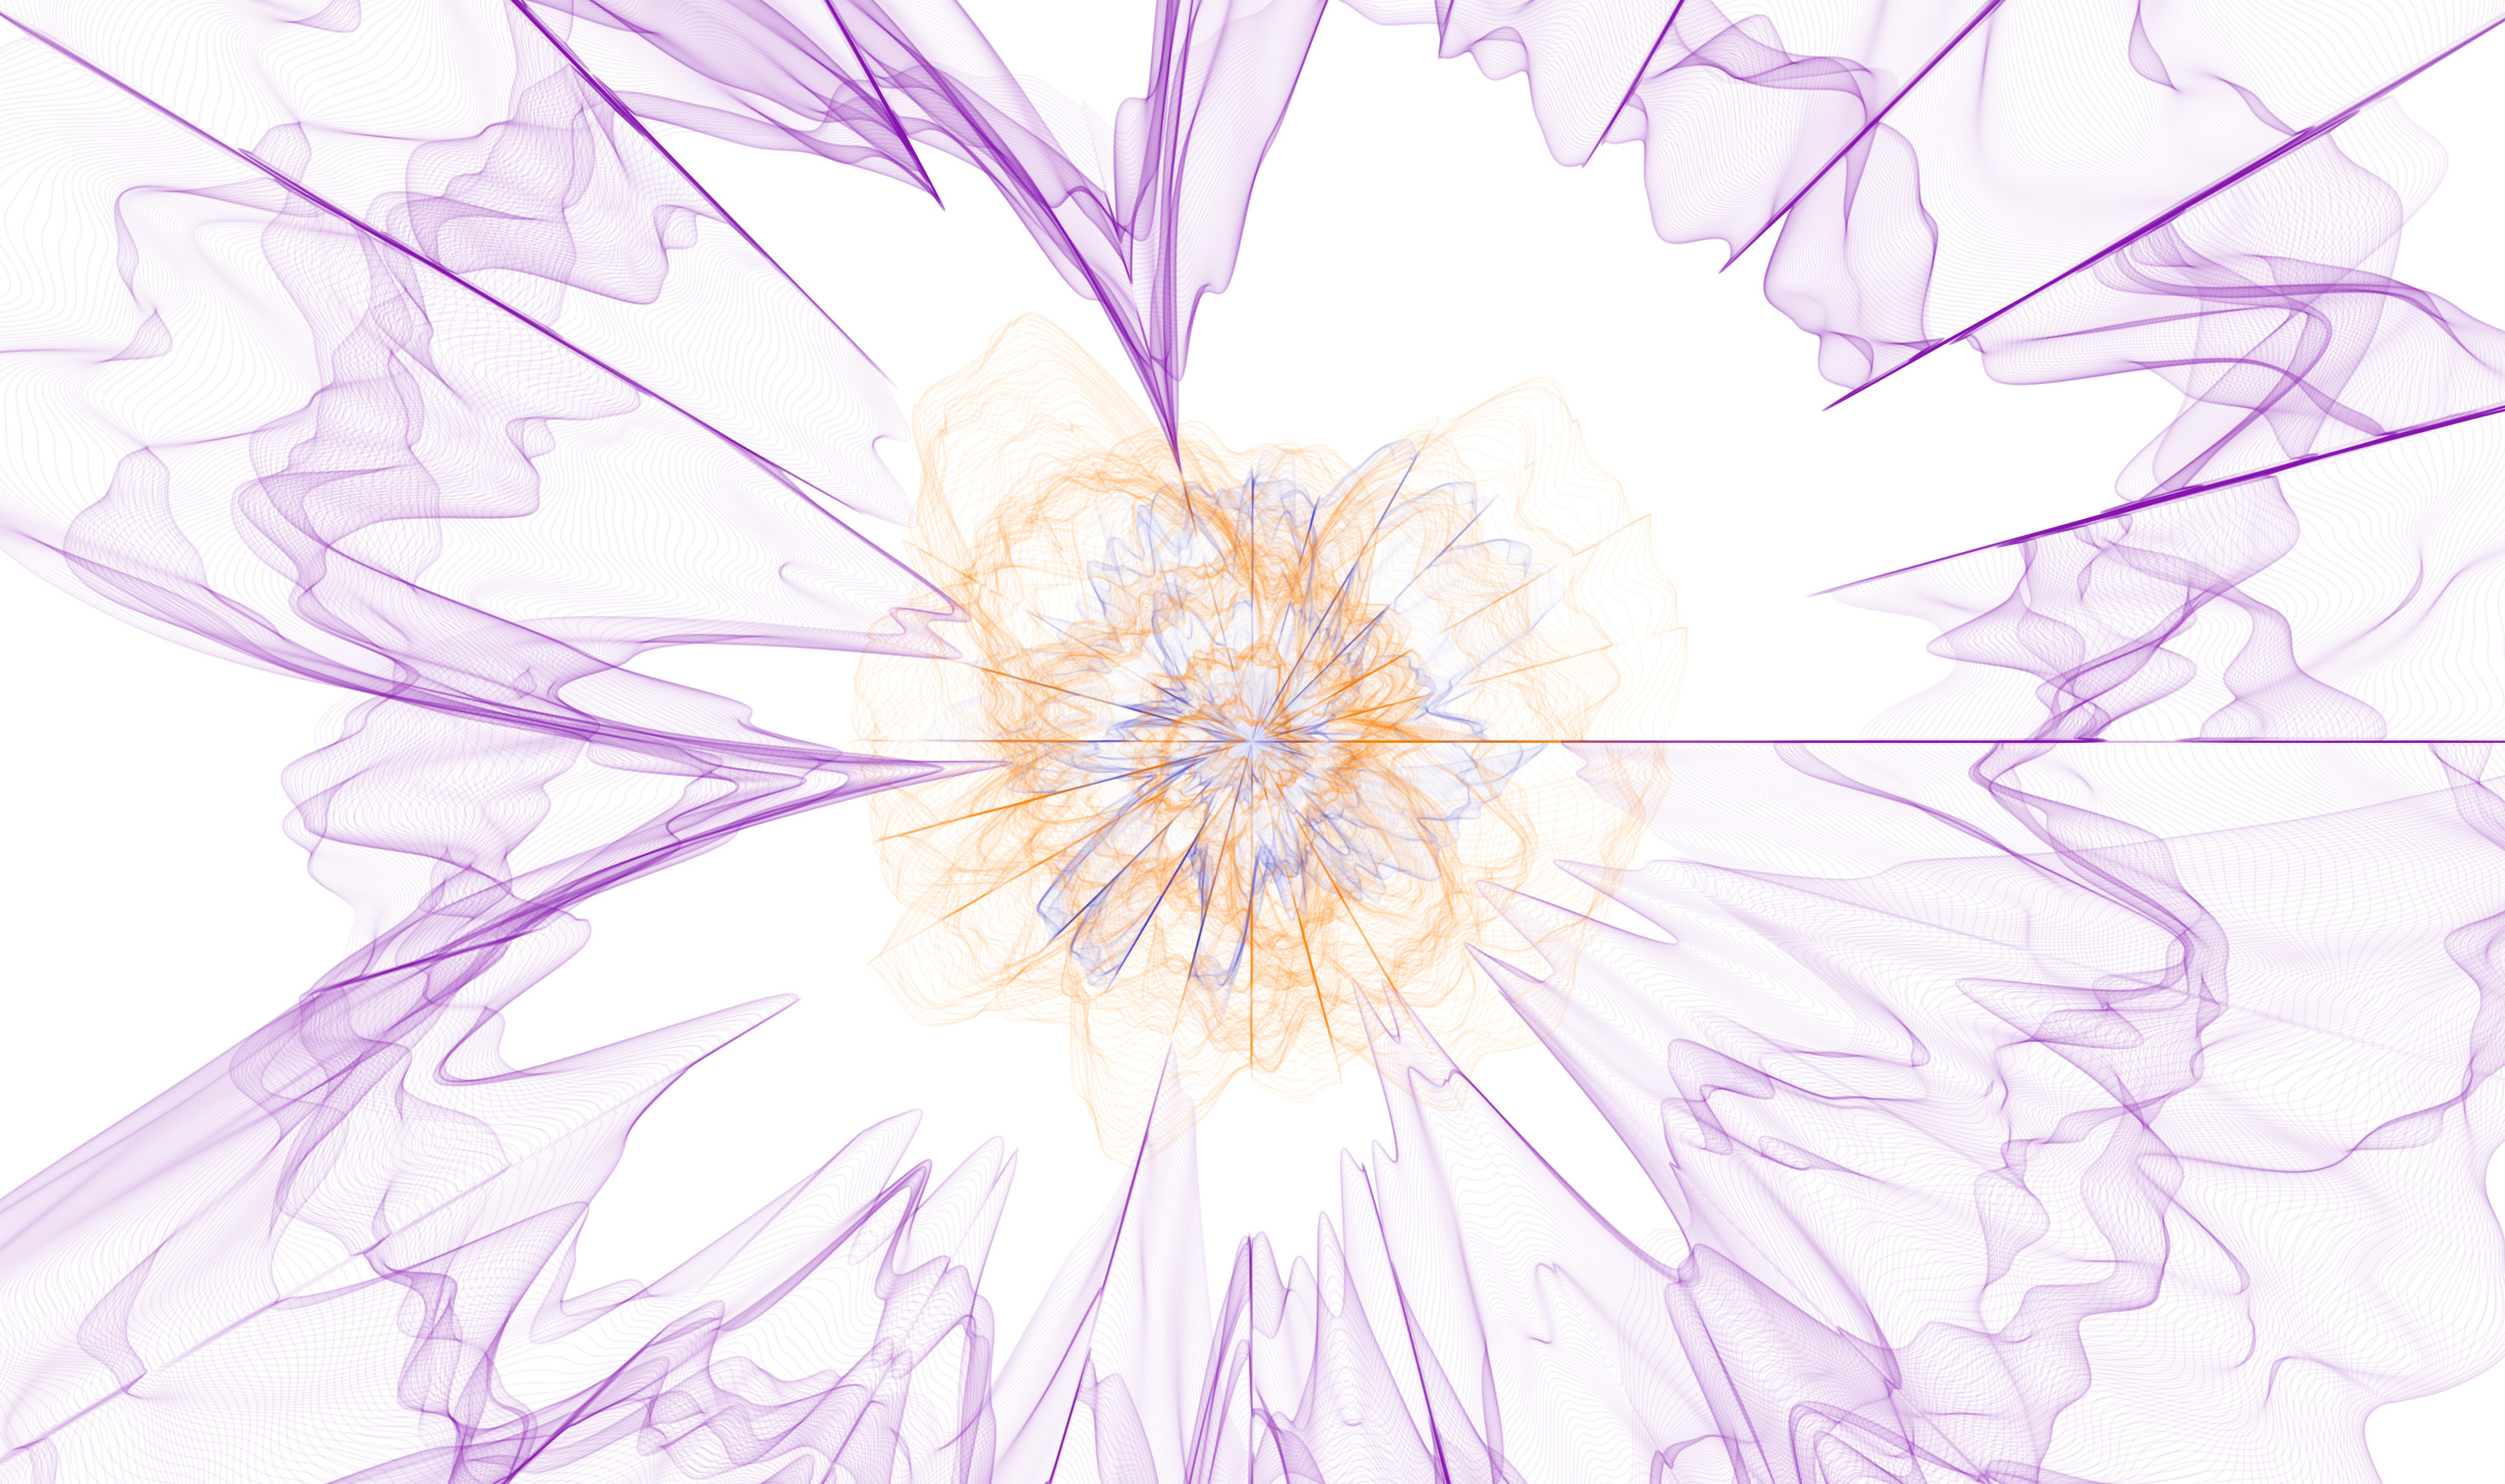
2007
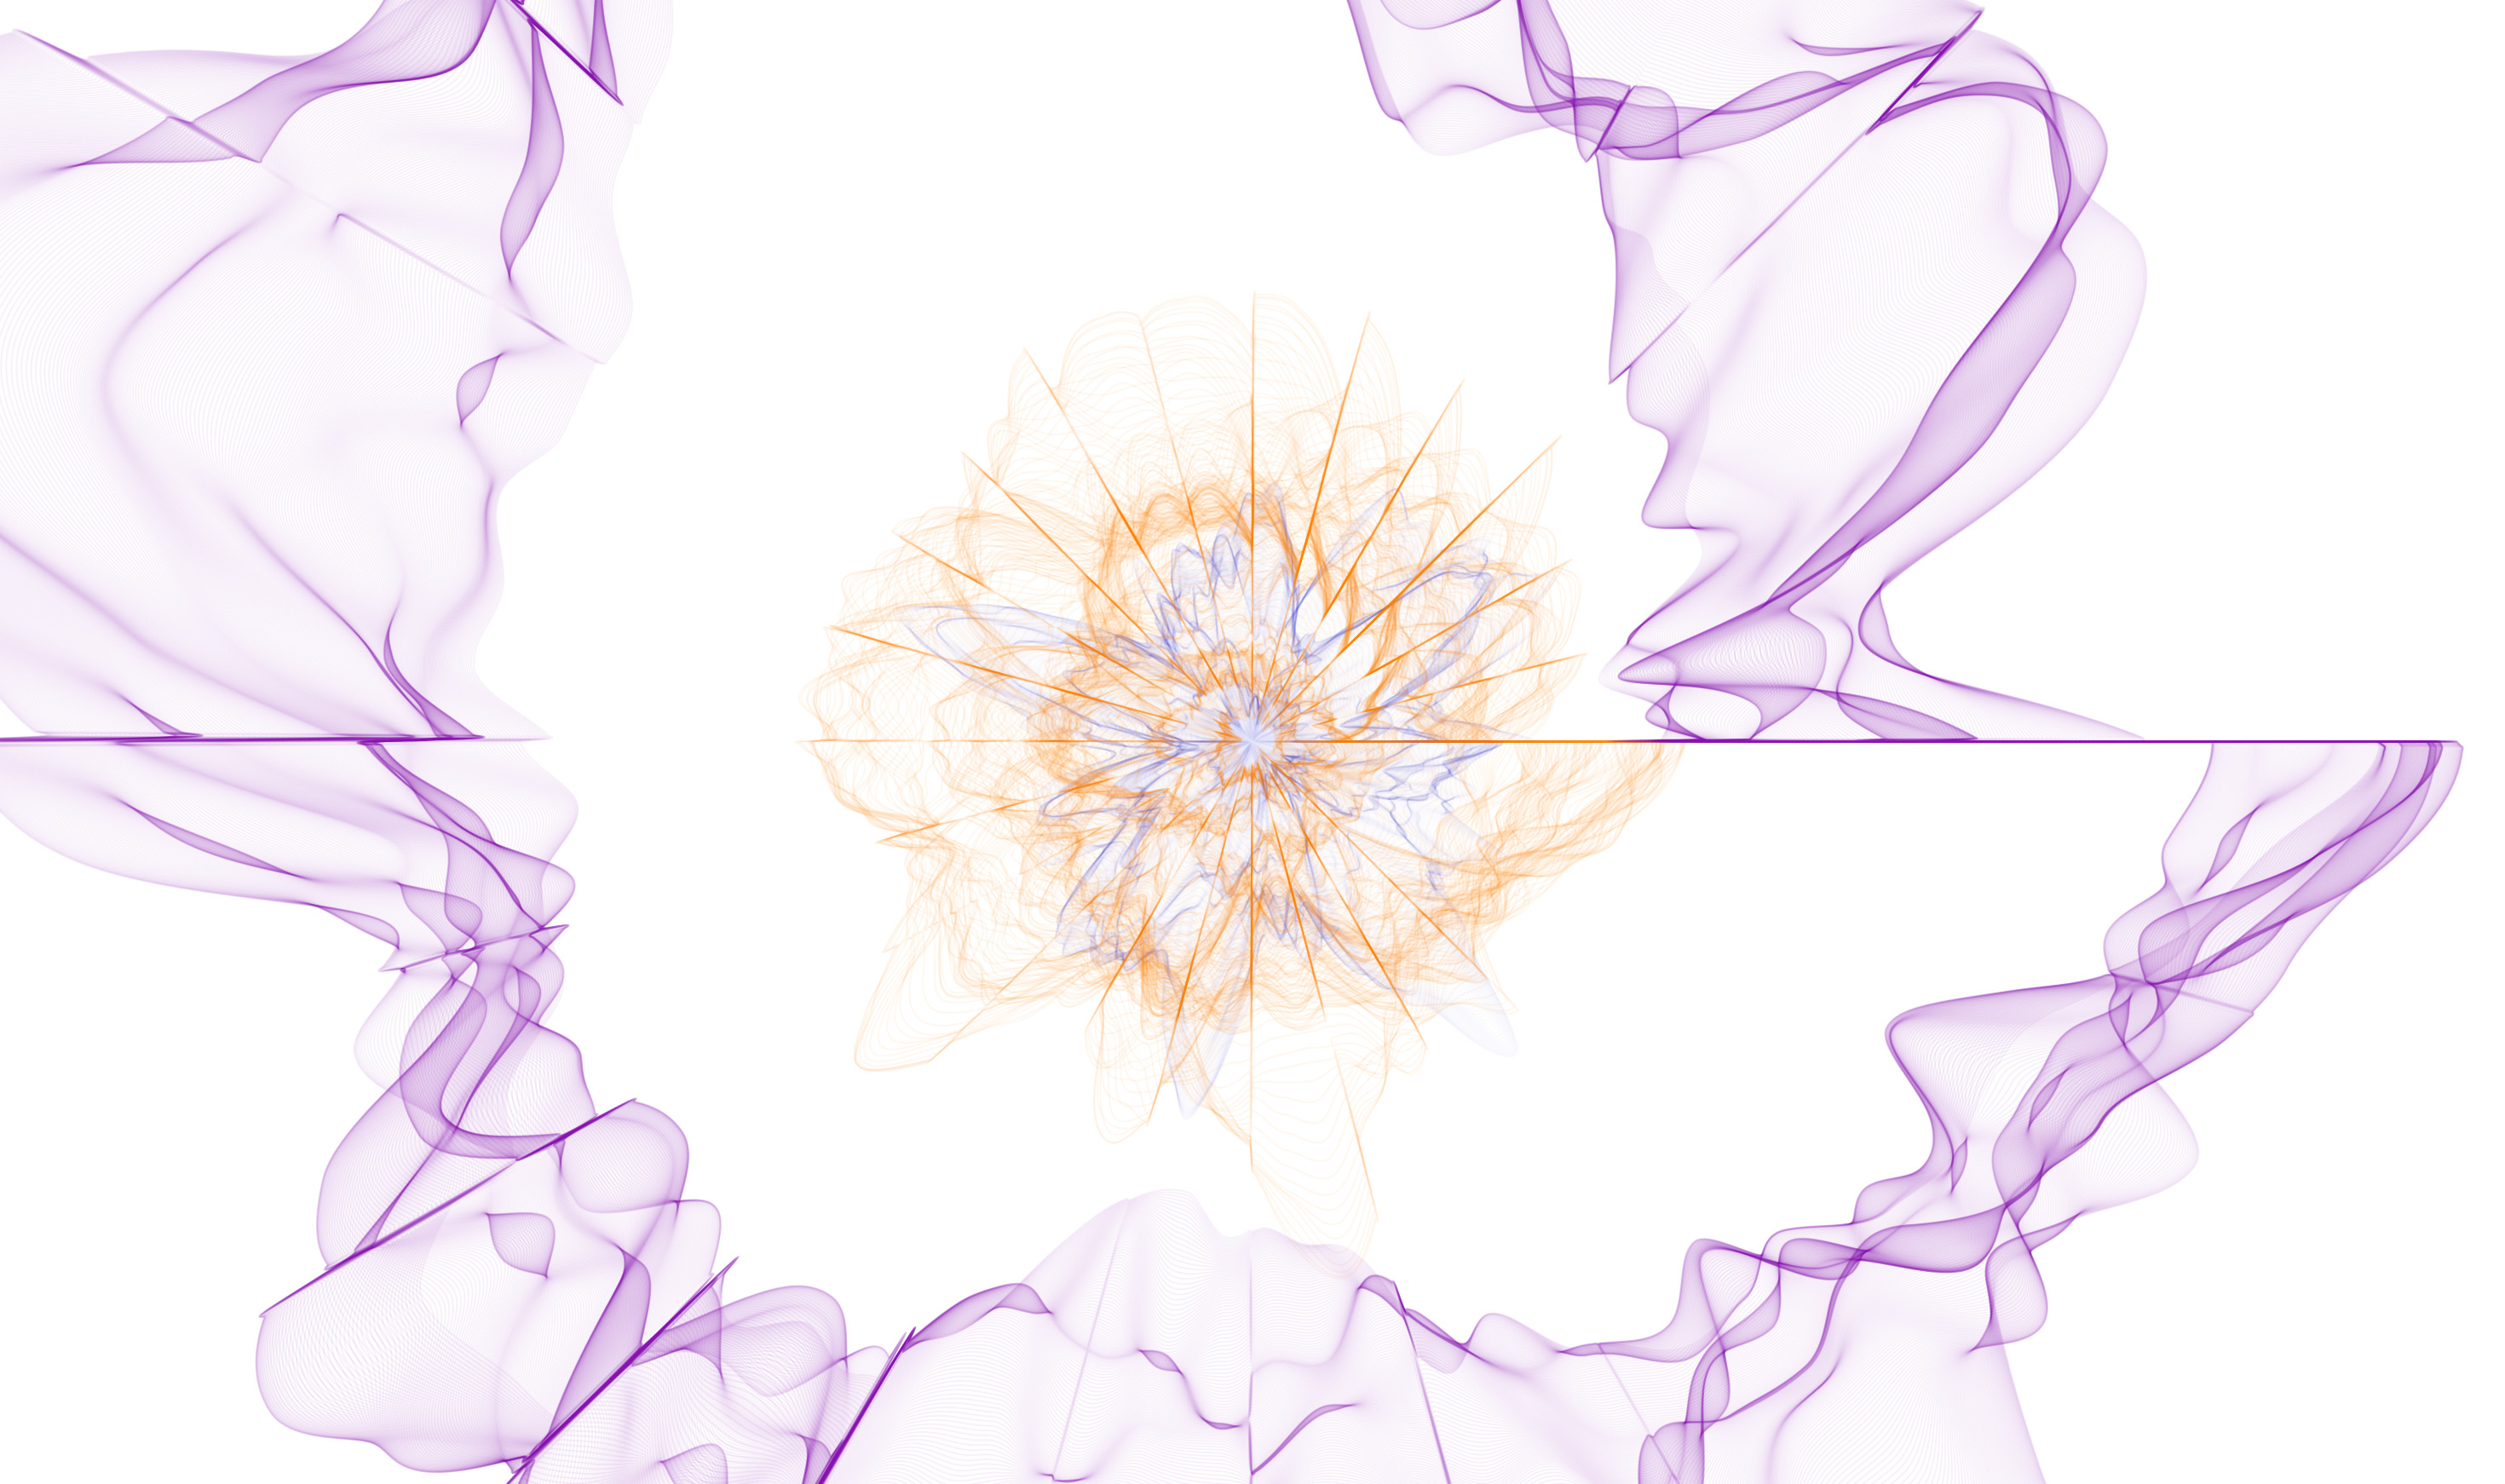
2008
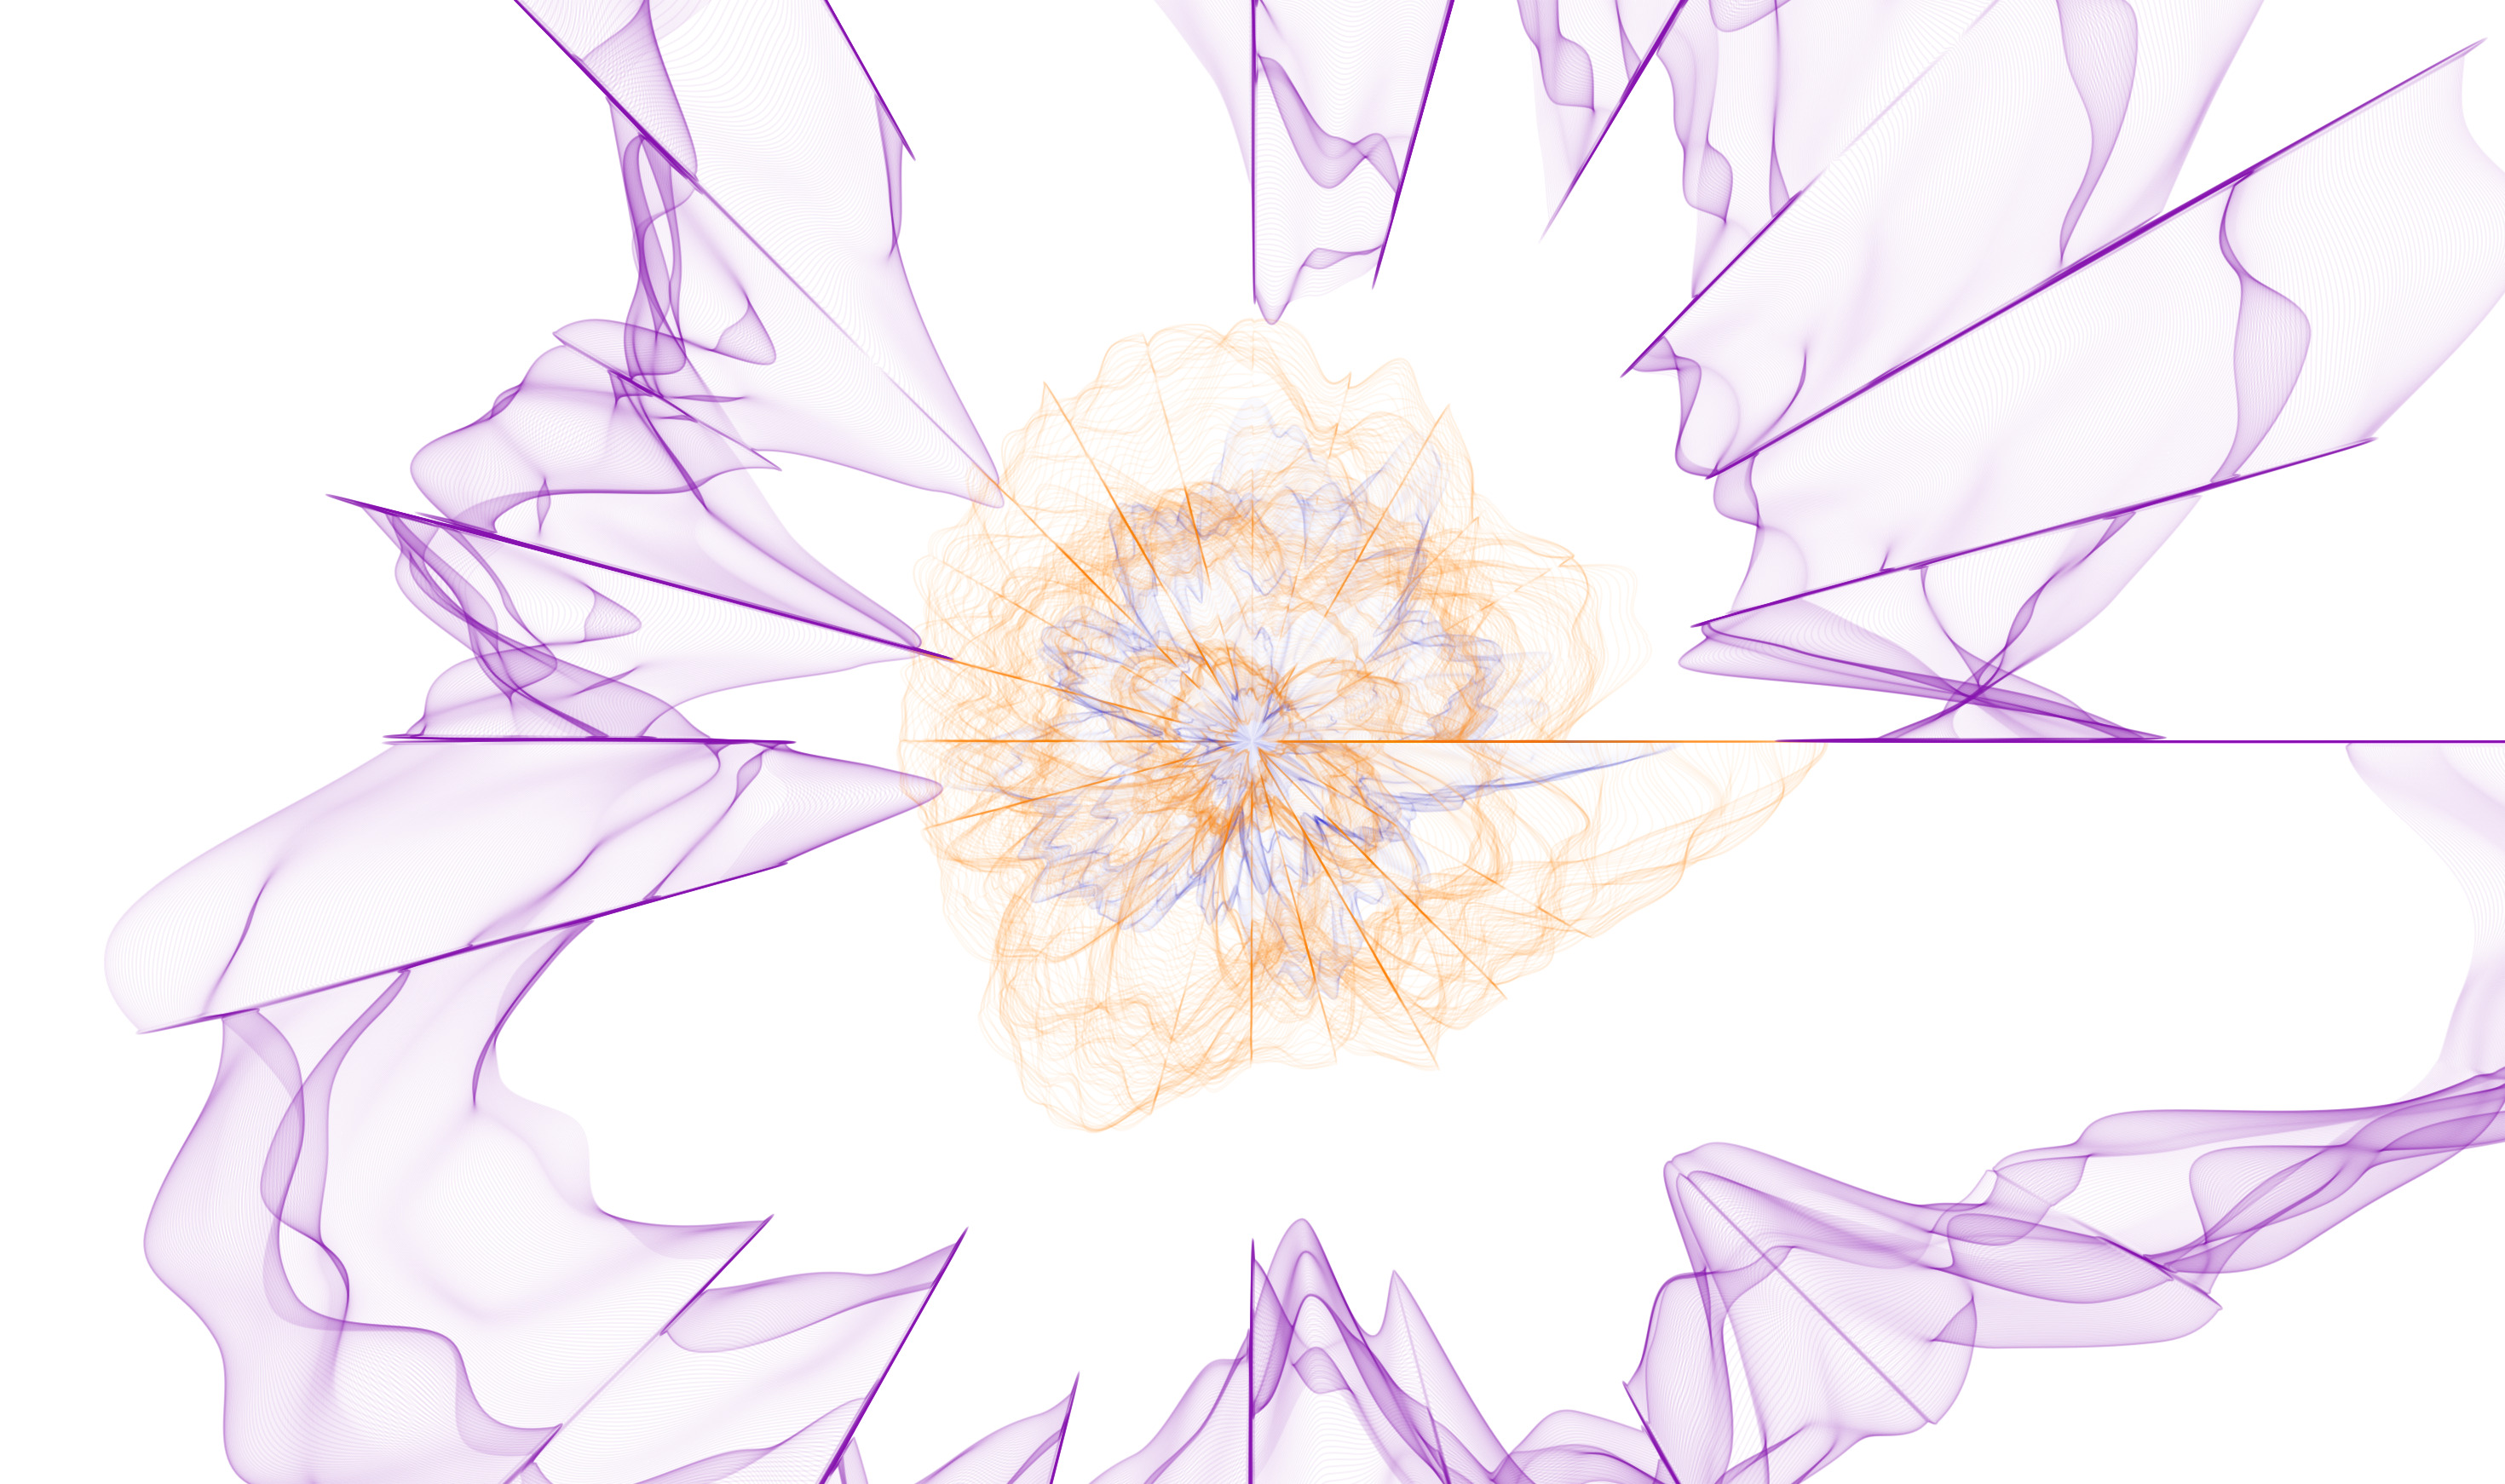
2009
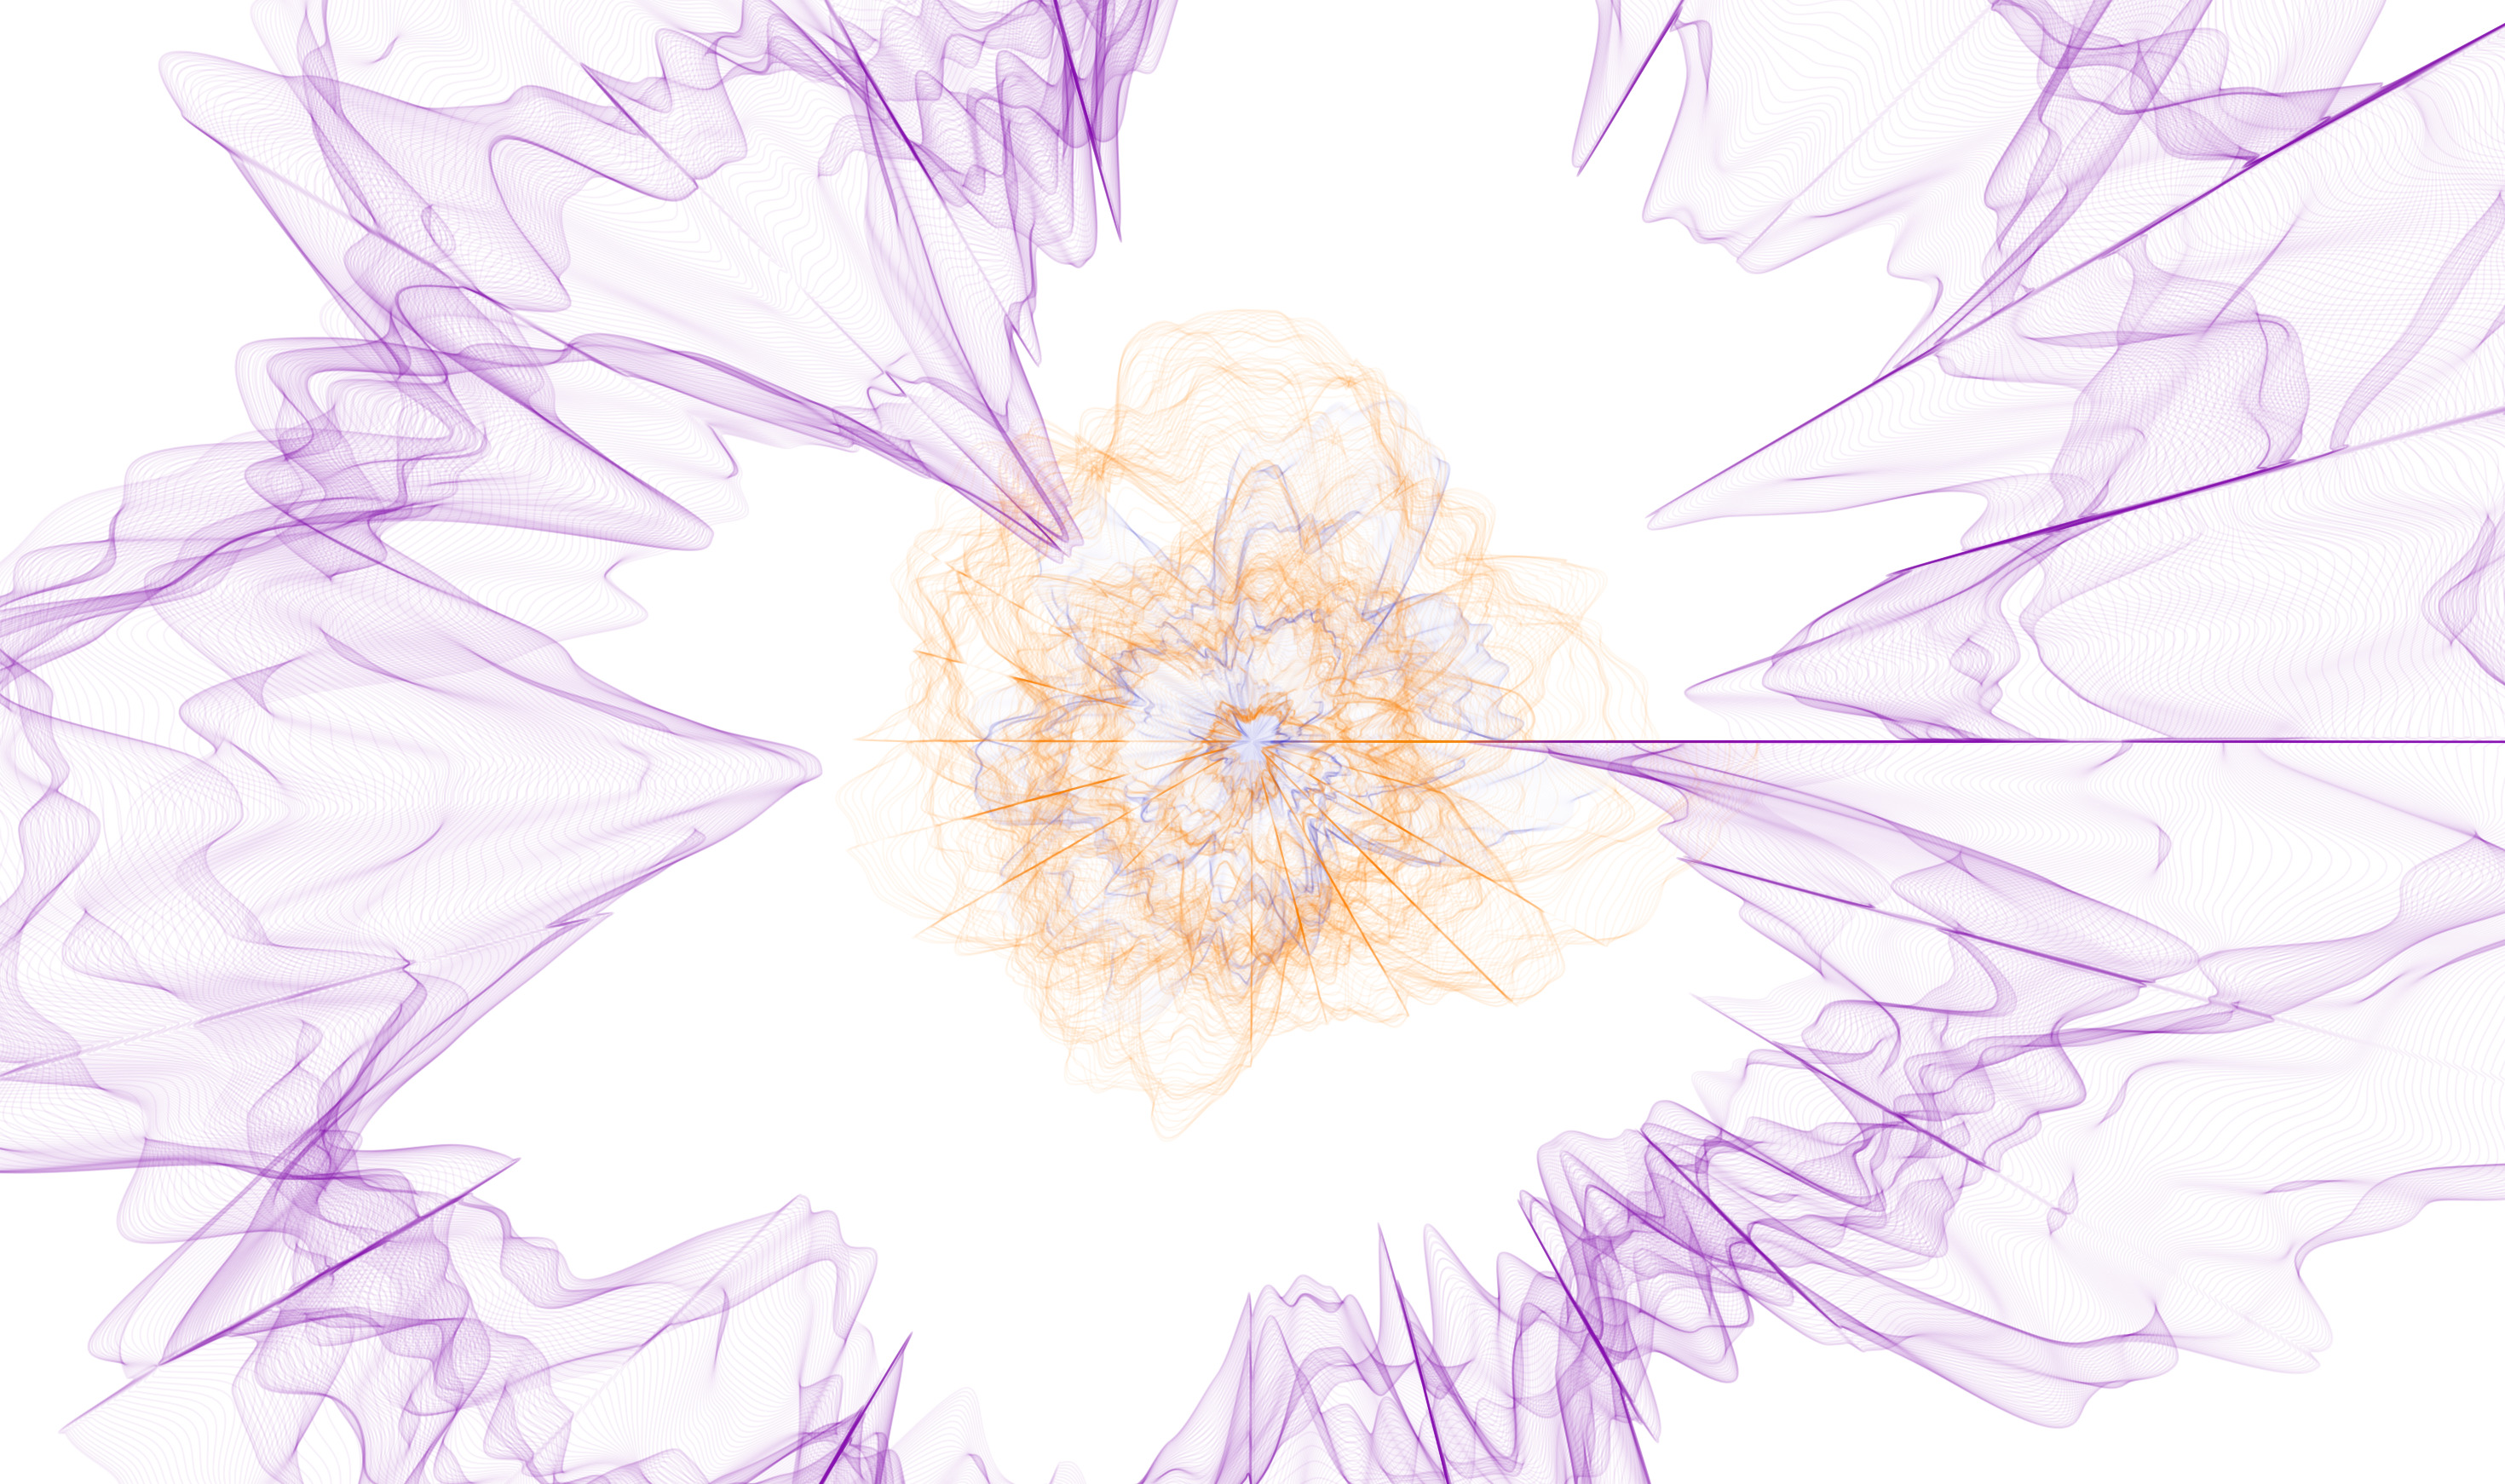
2010

2011
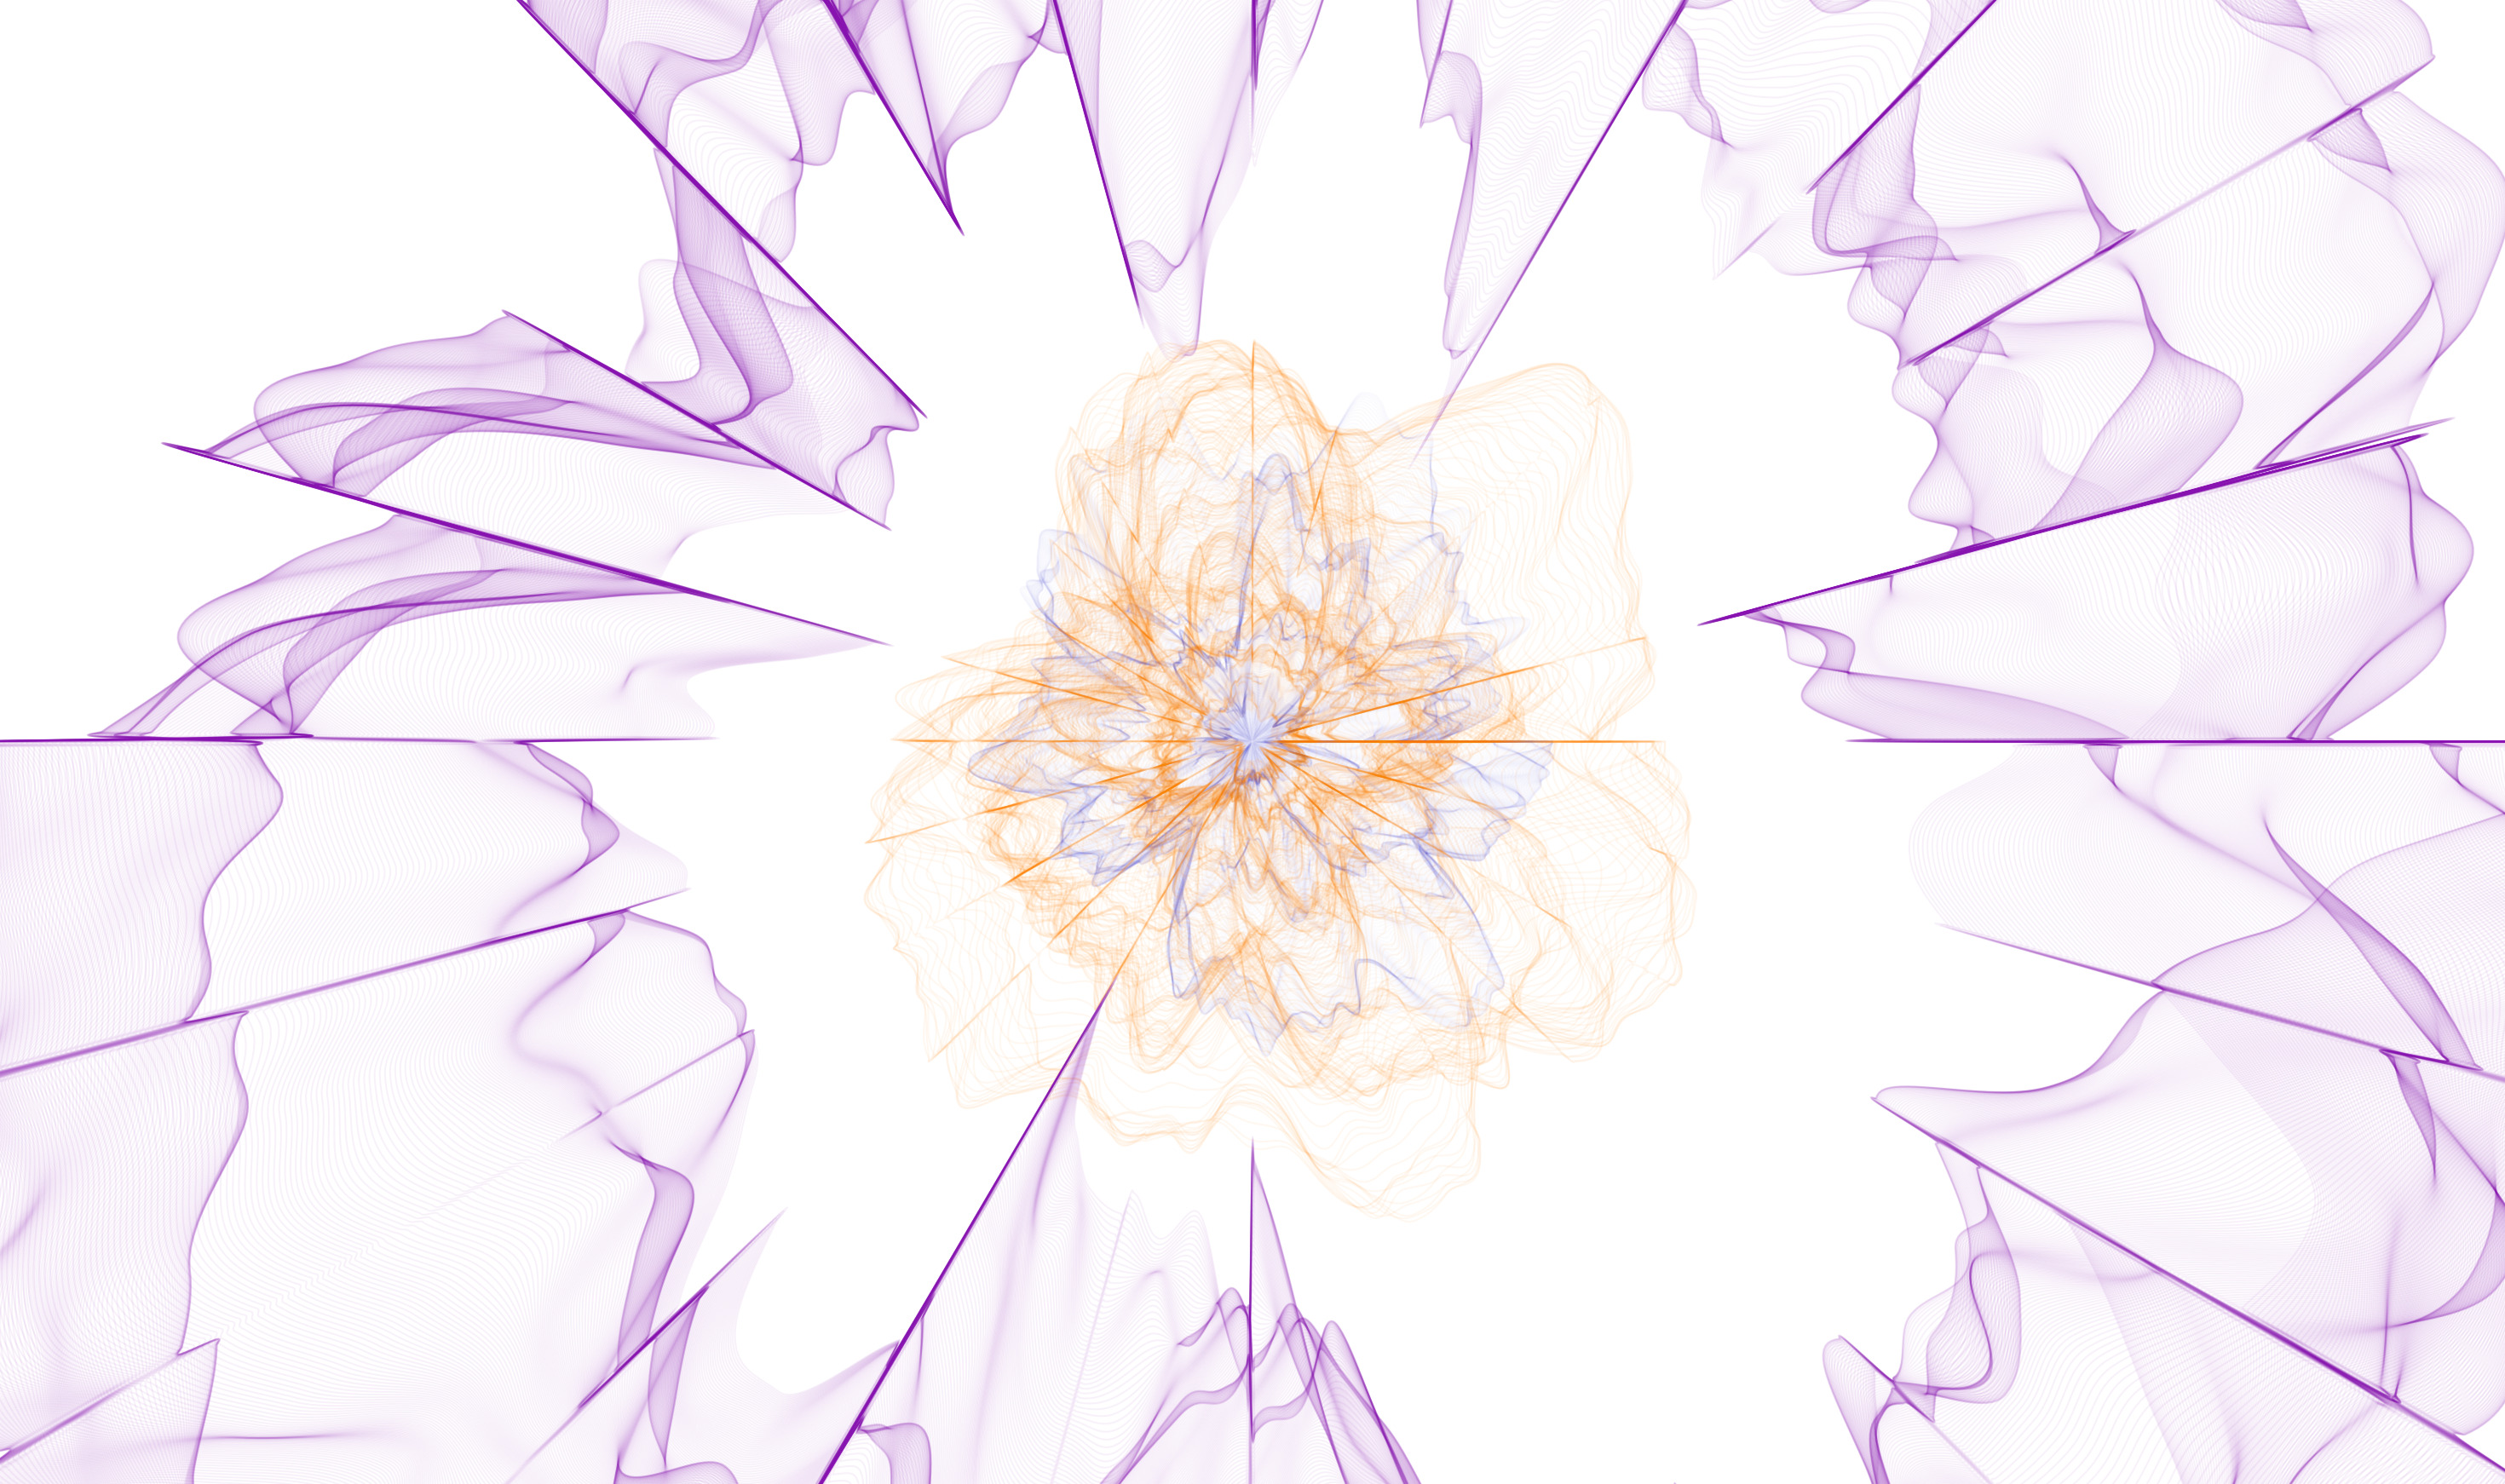
2012
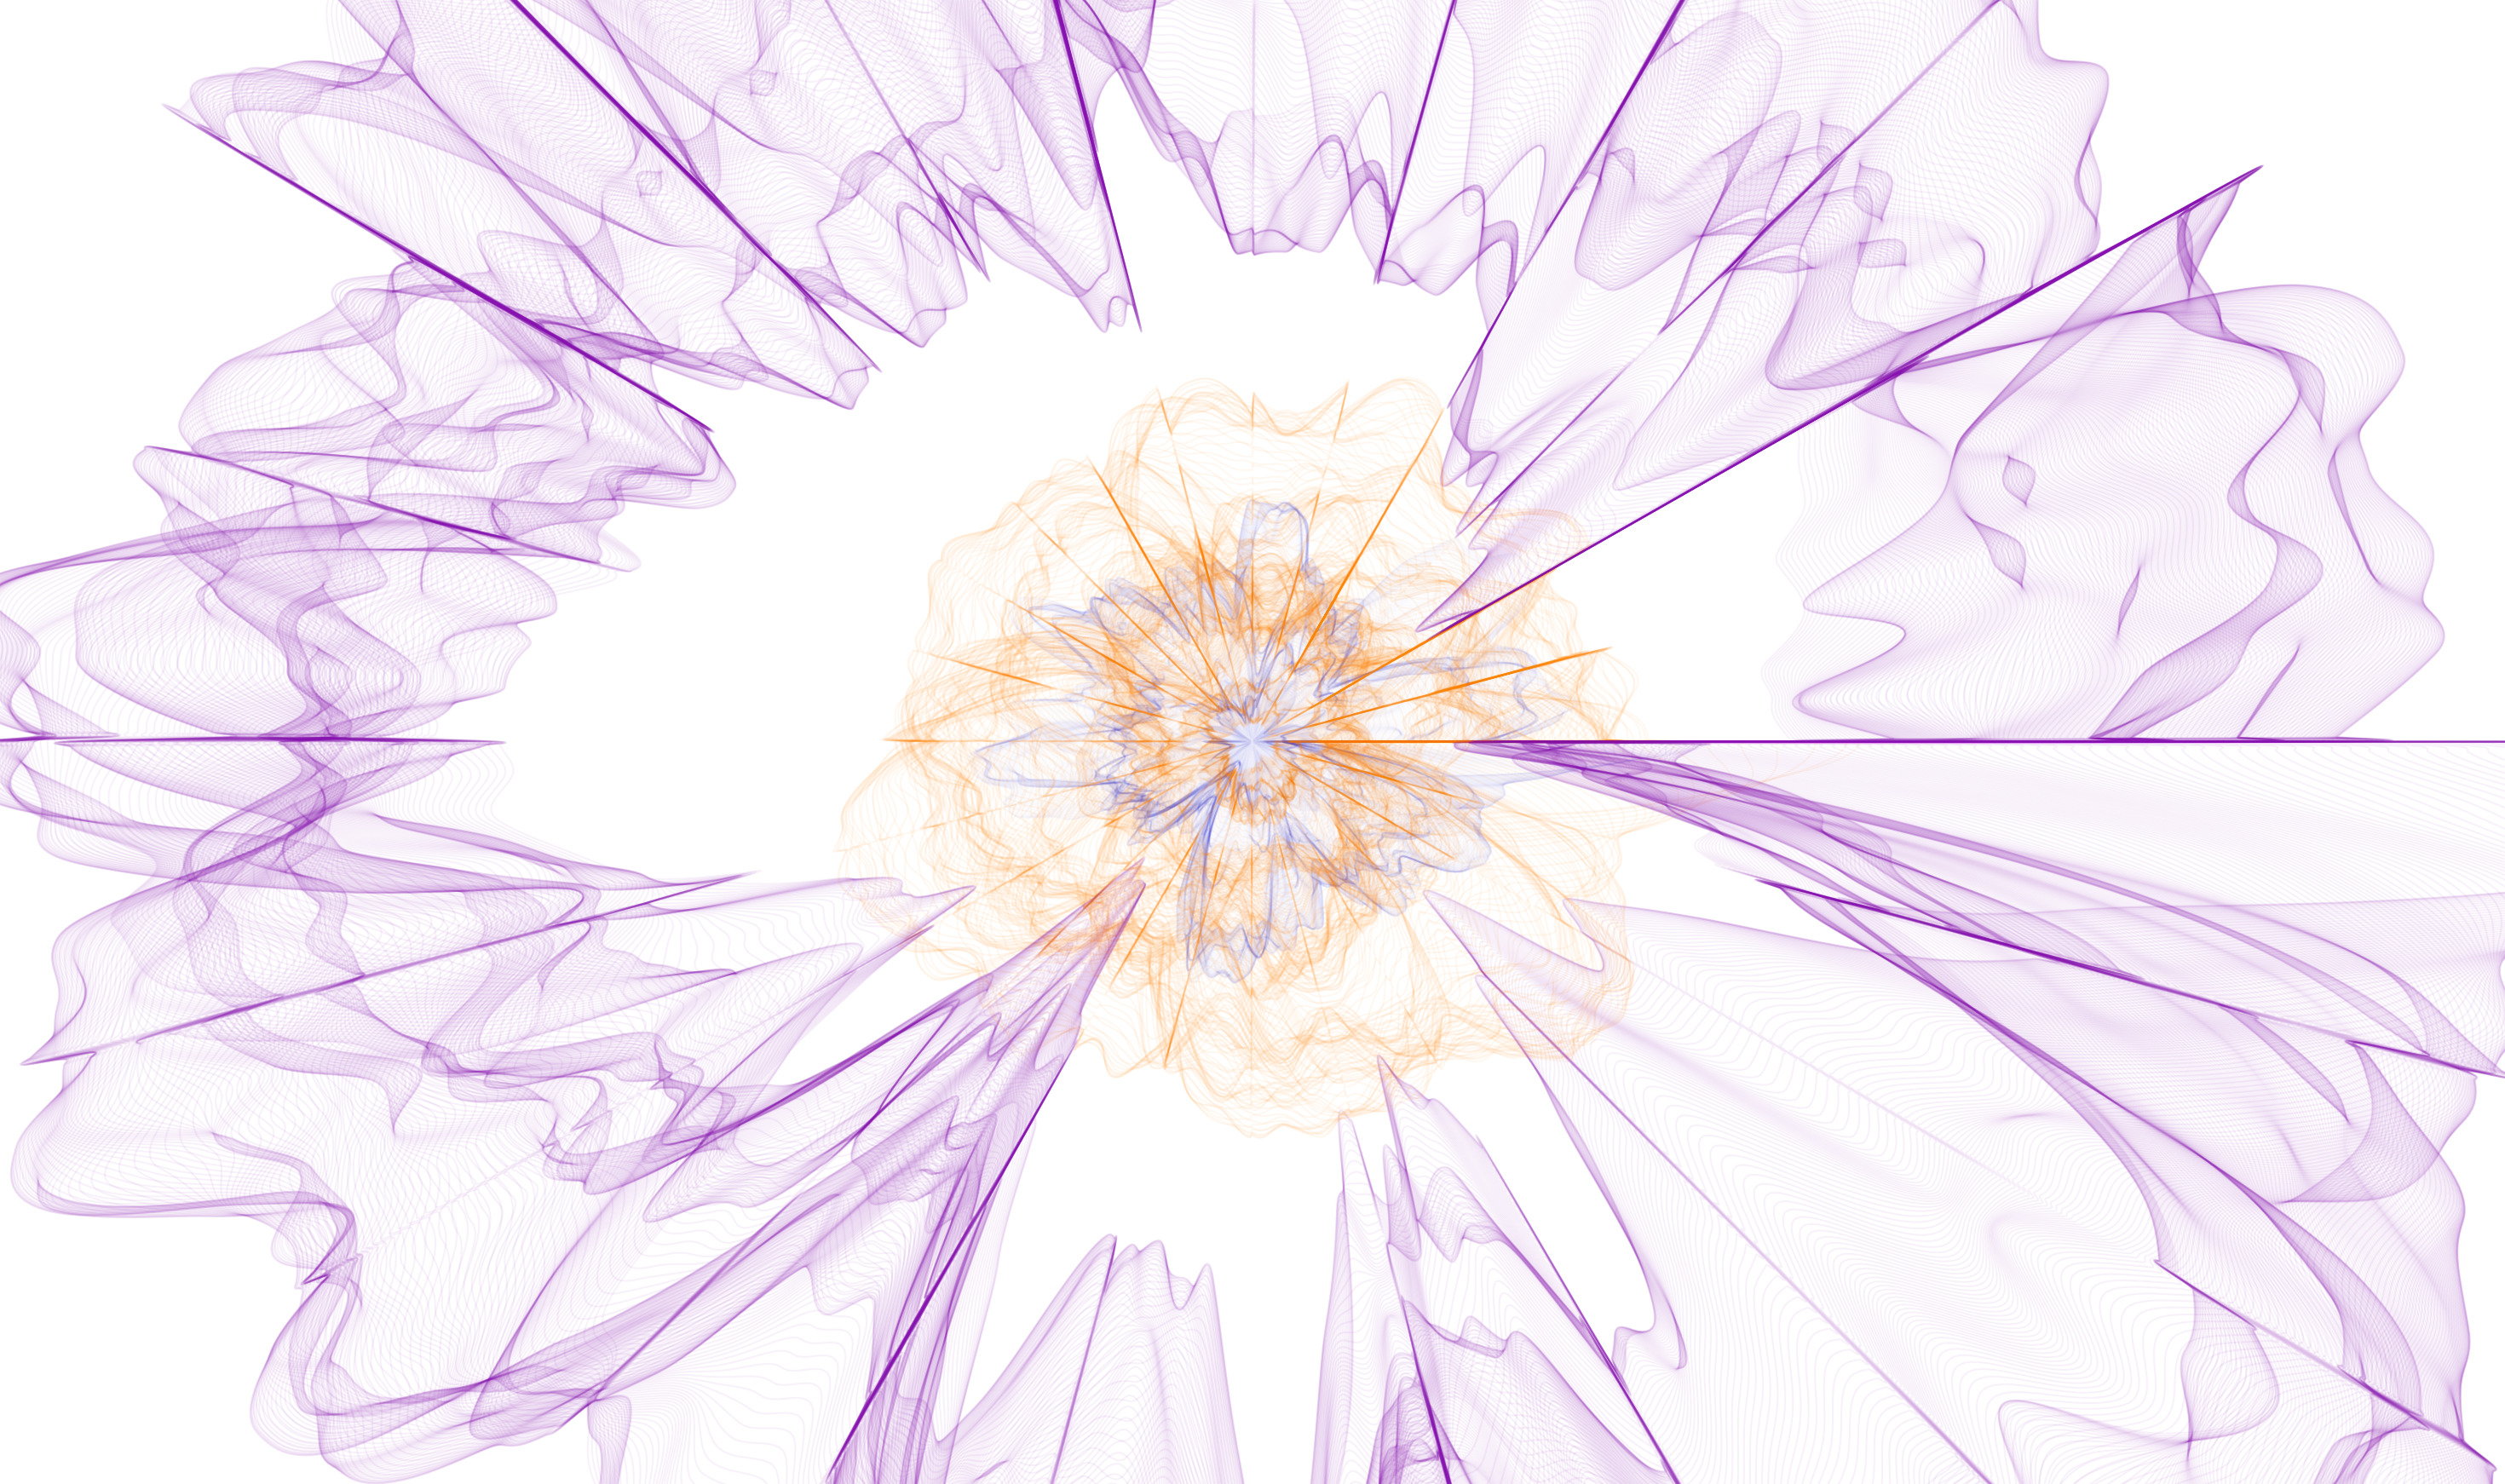
2013
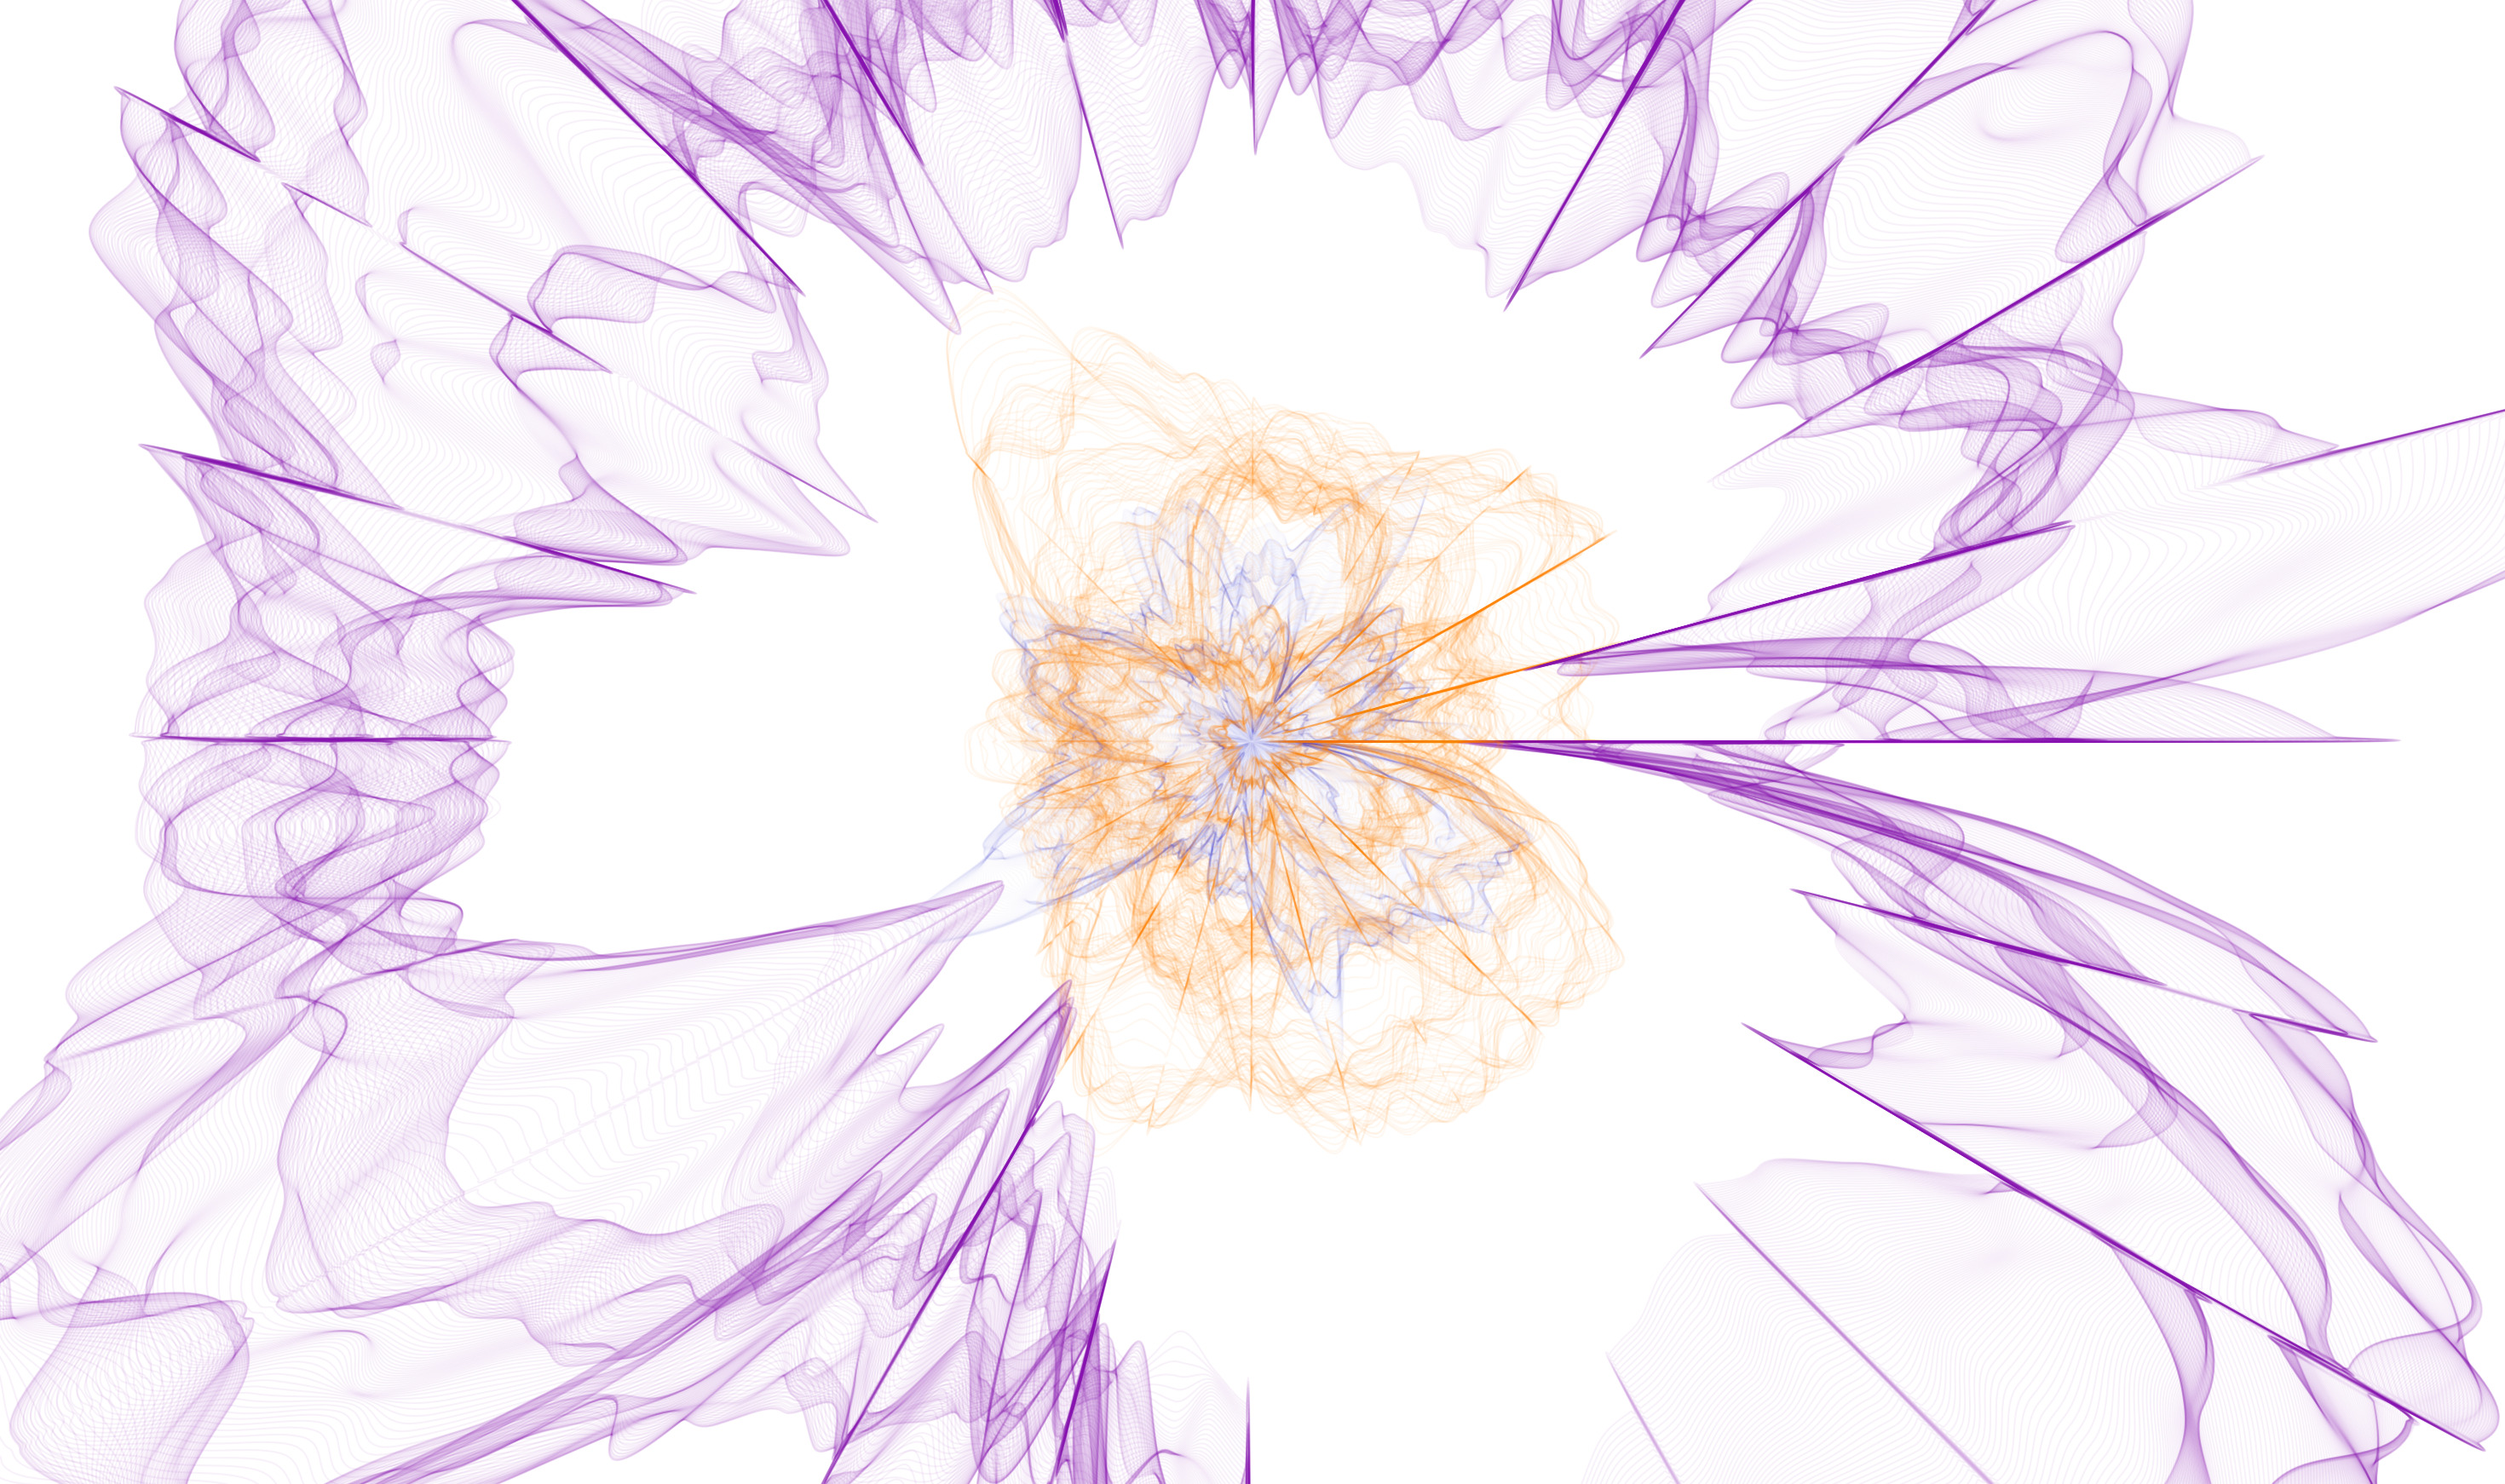
2014
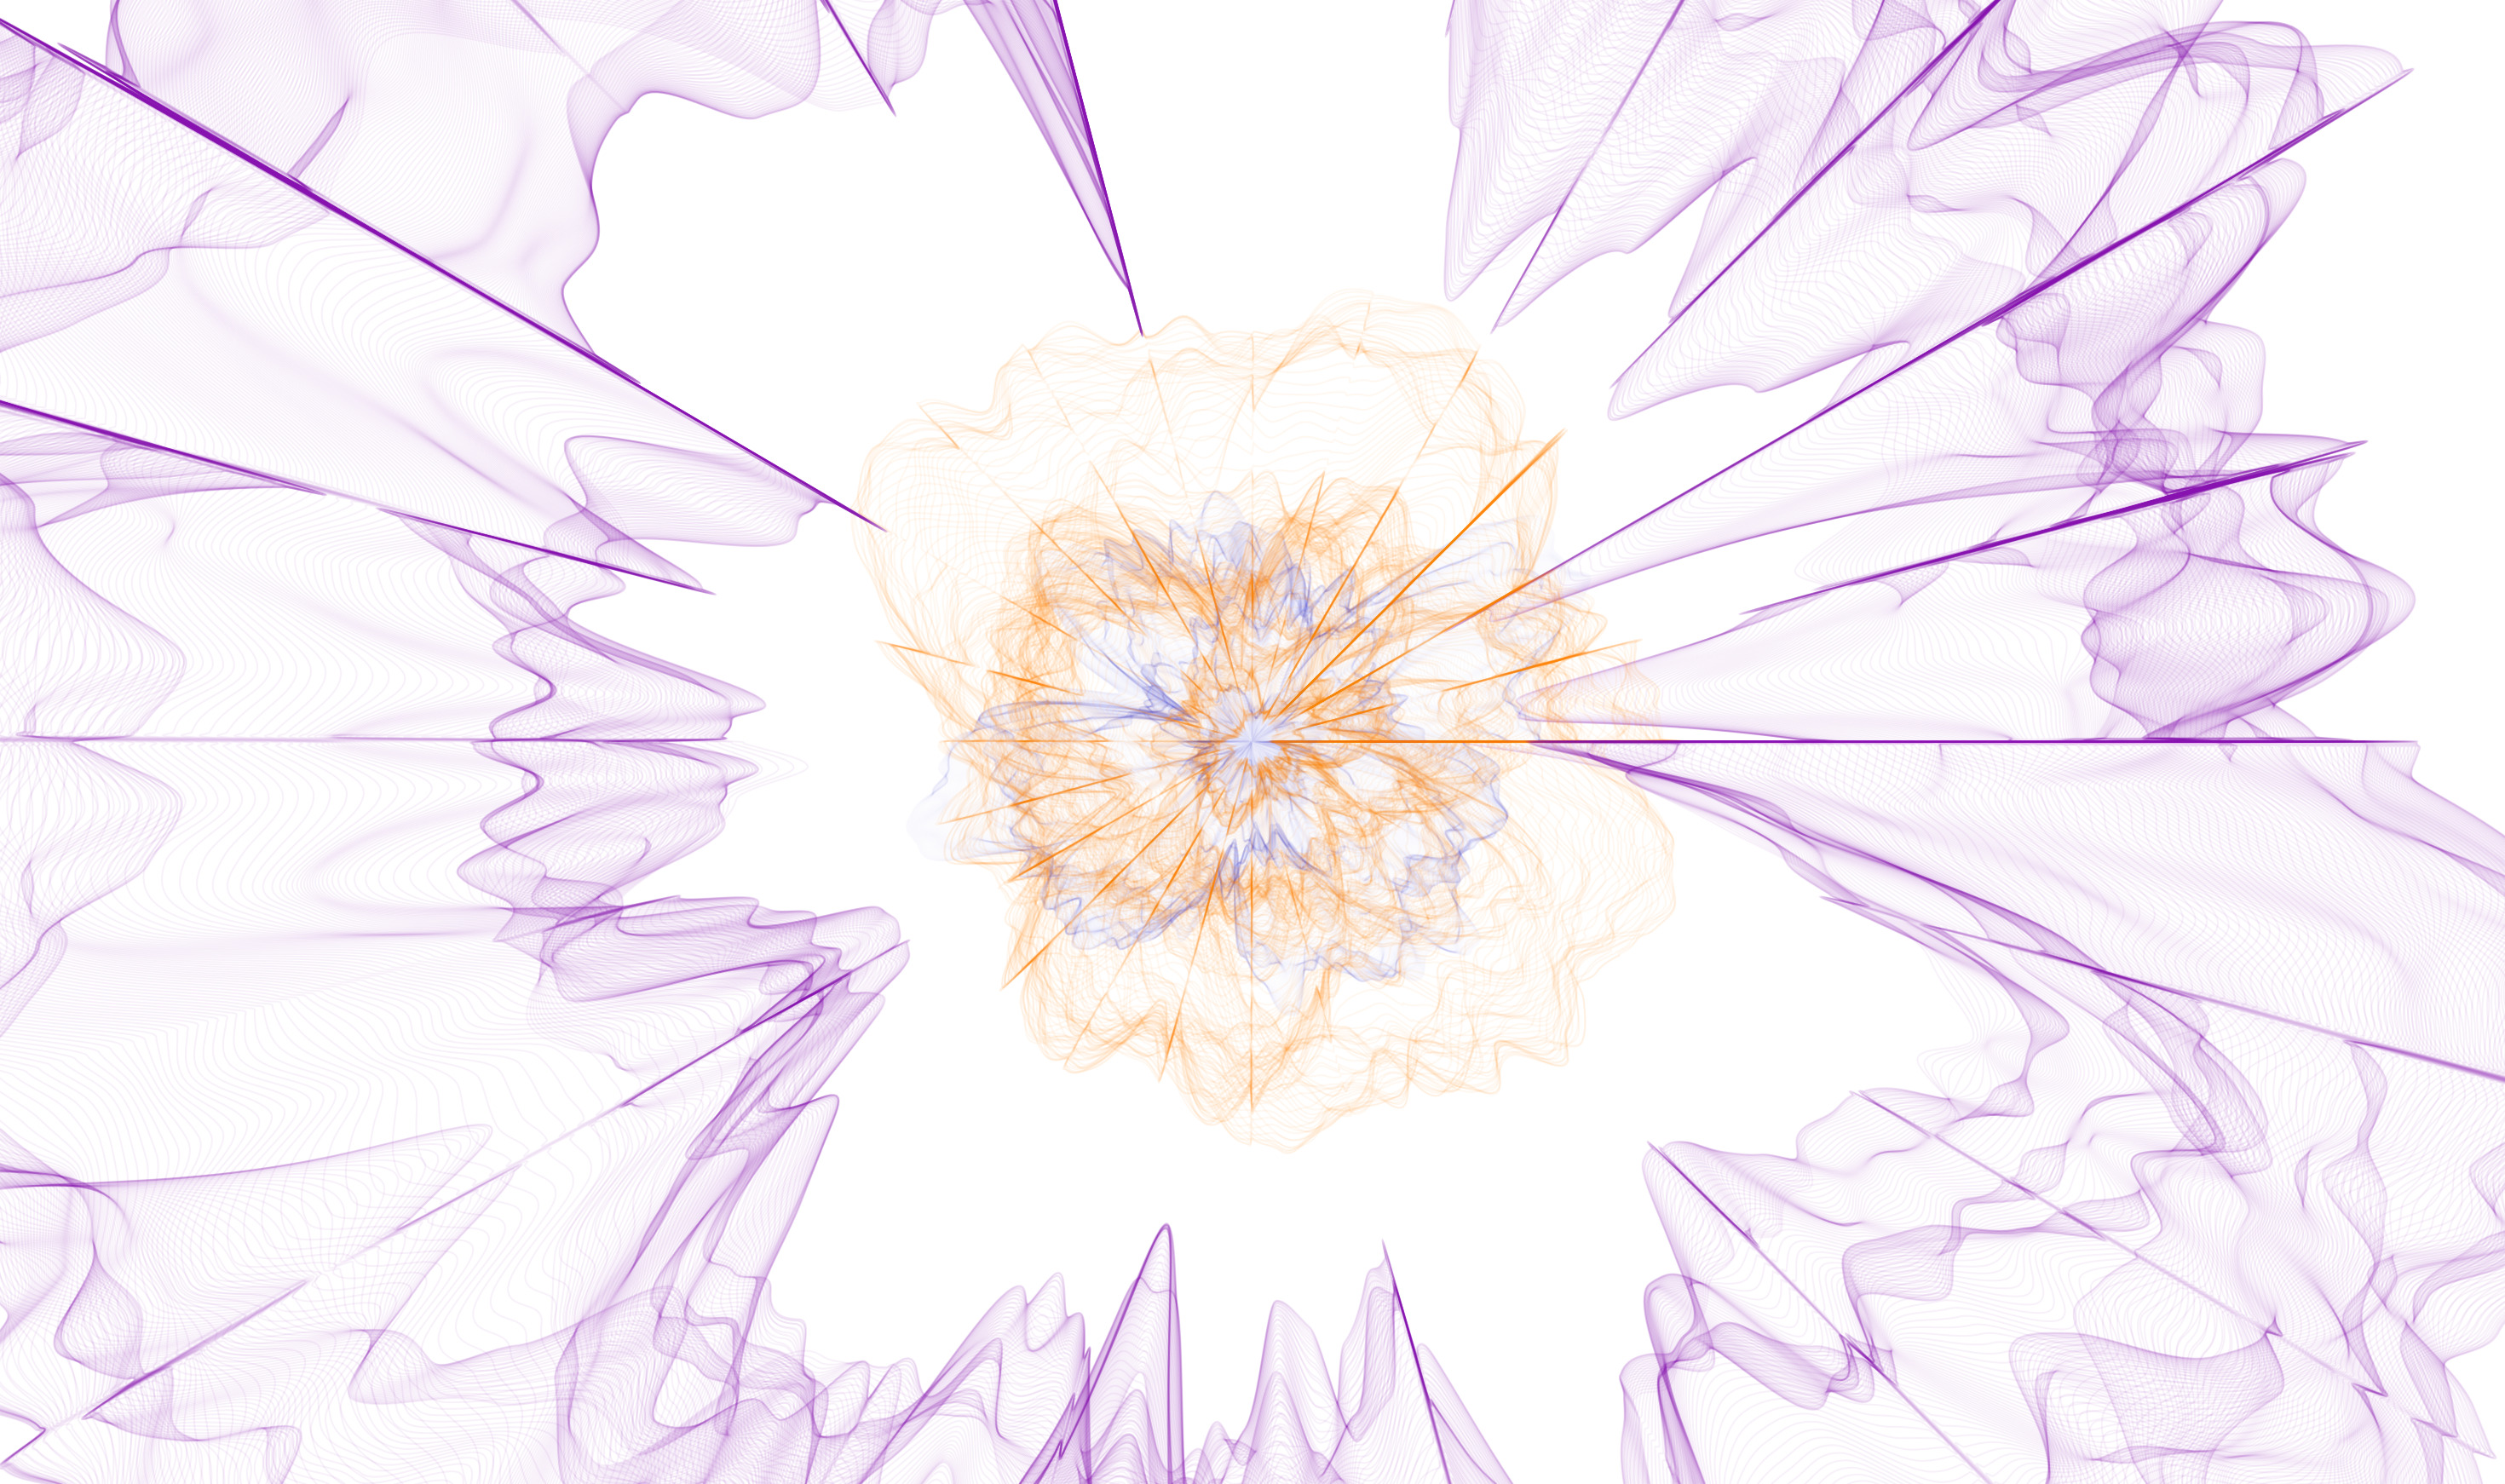
2015
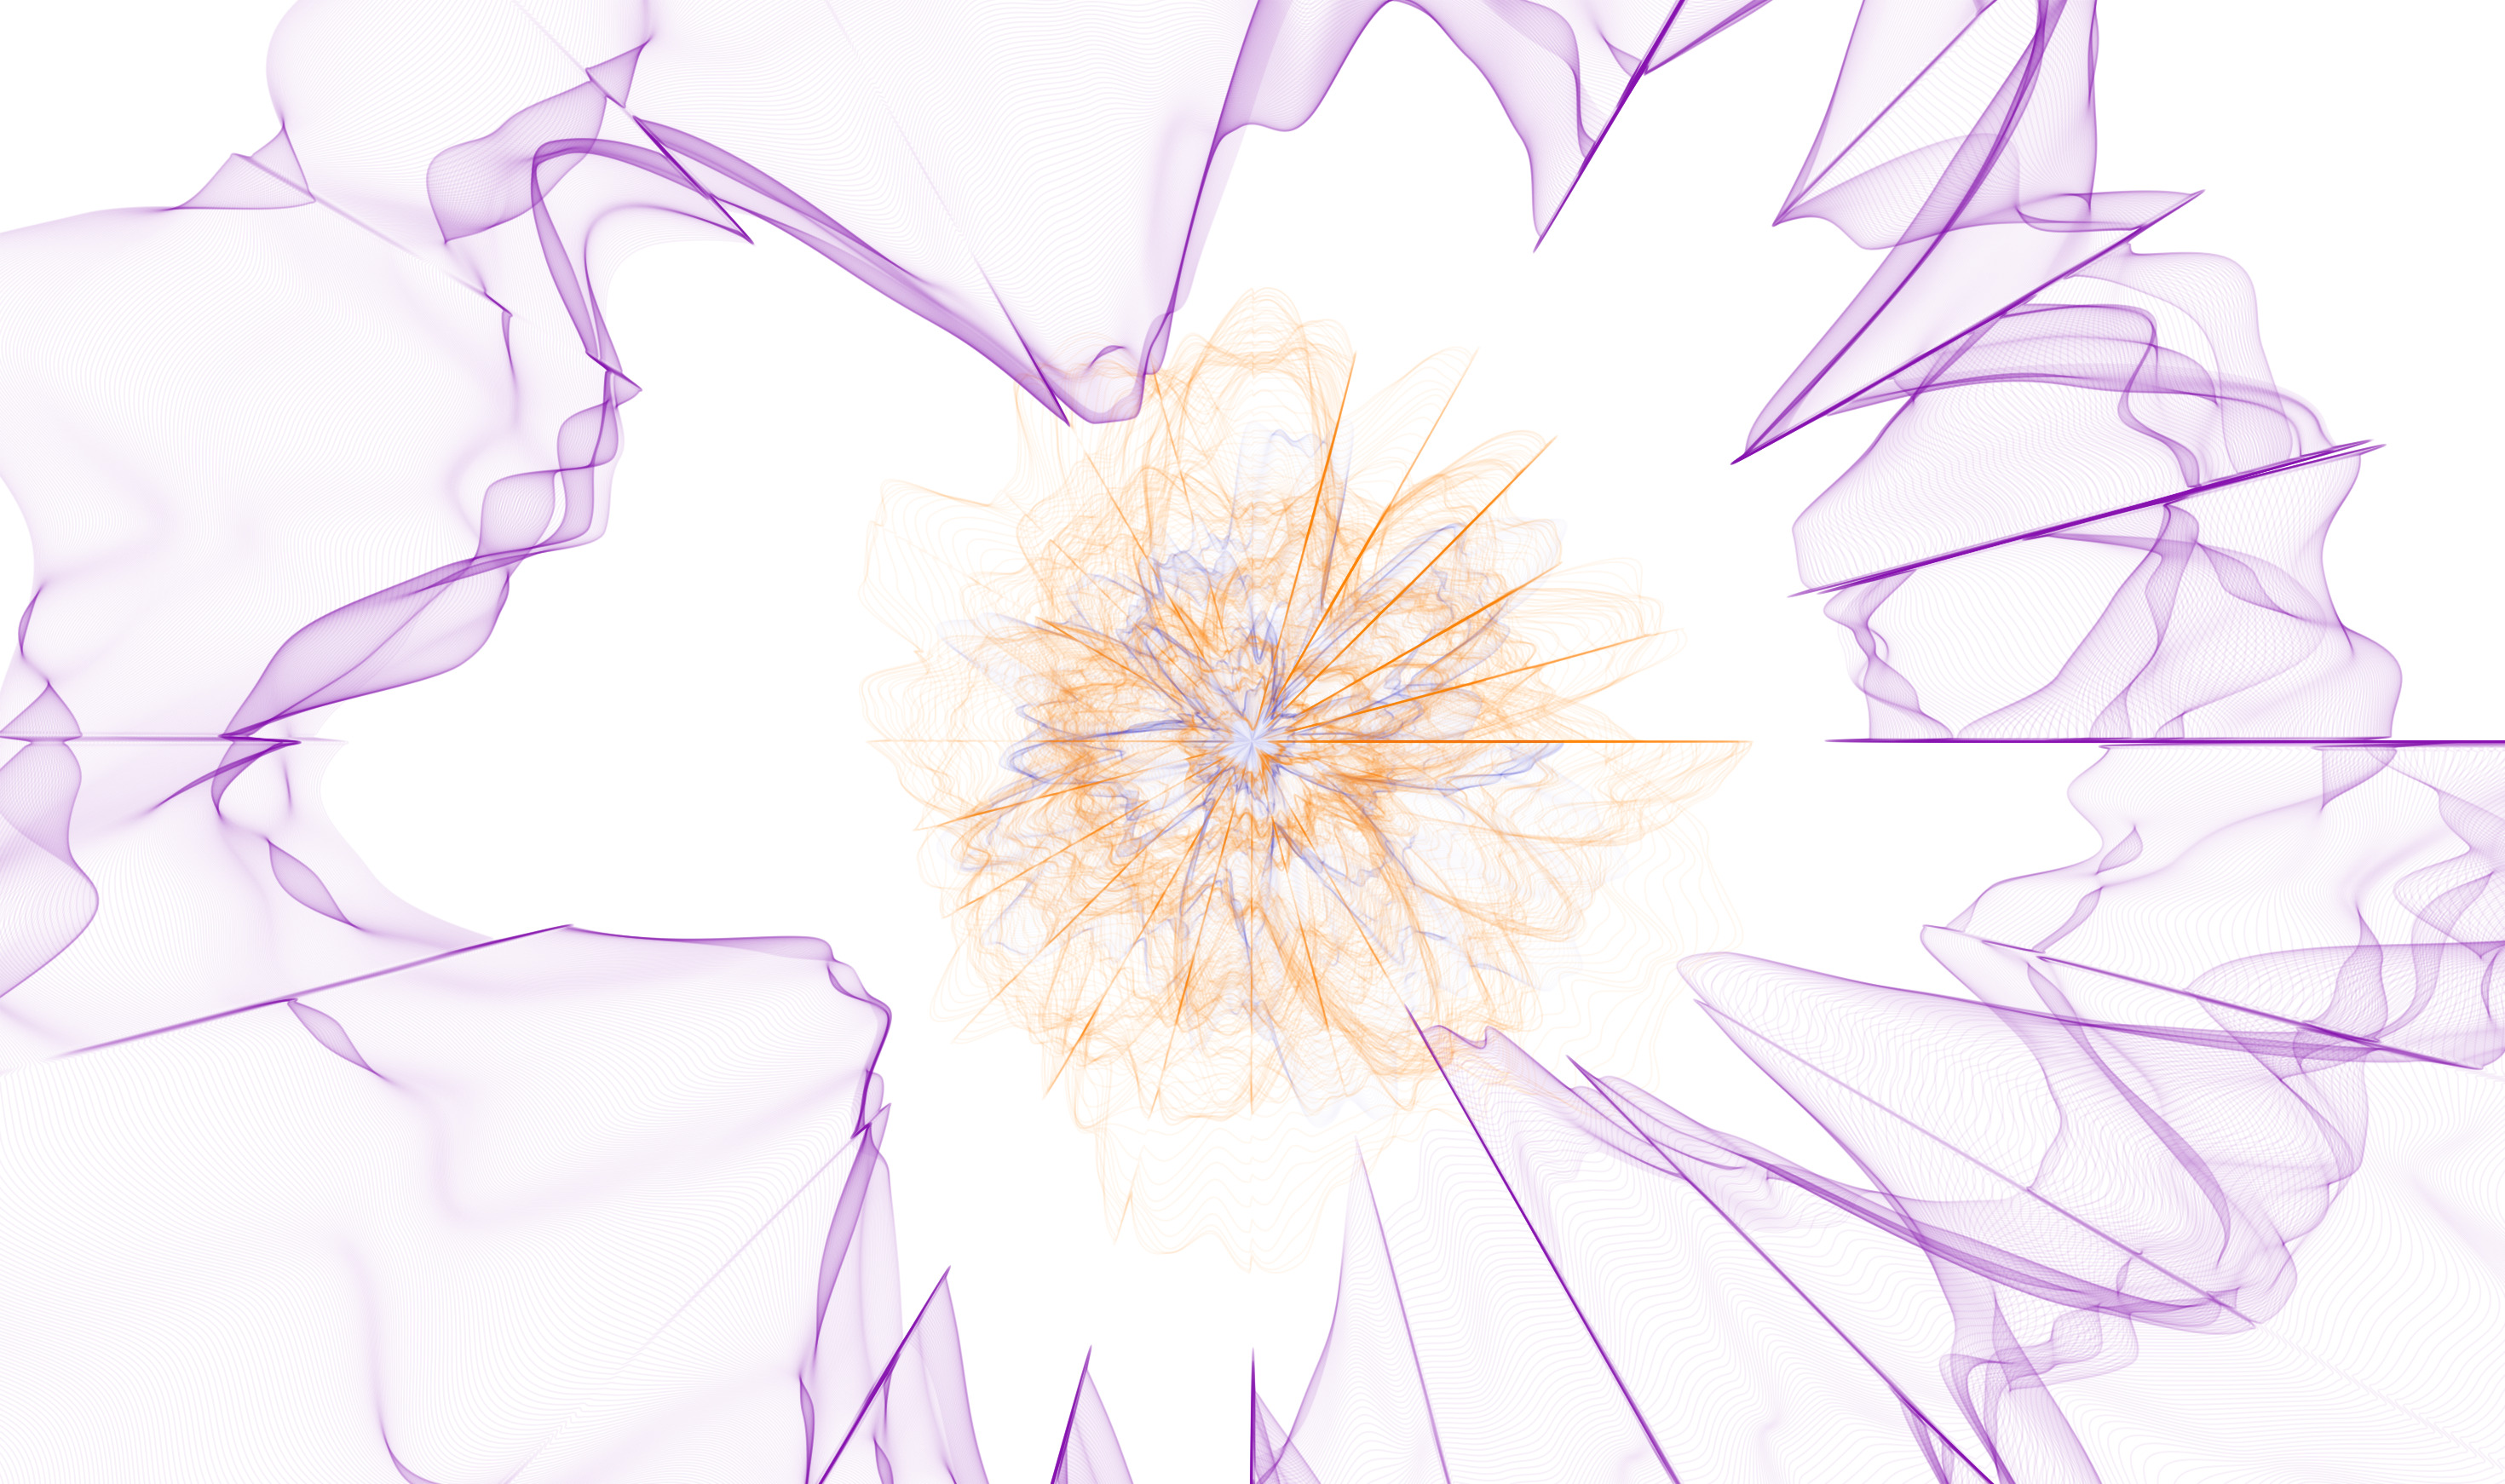
2016
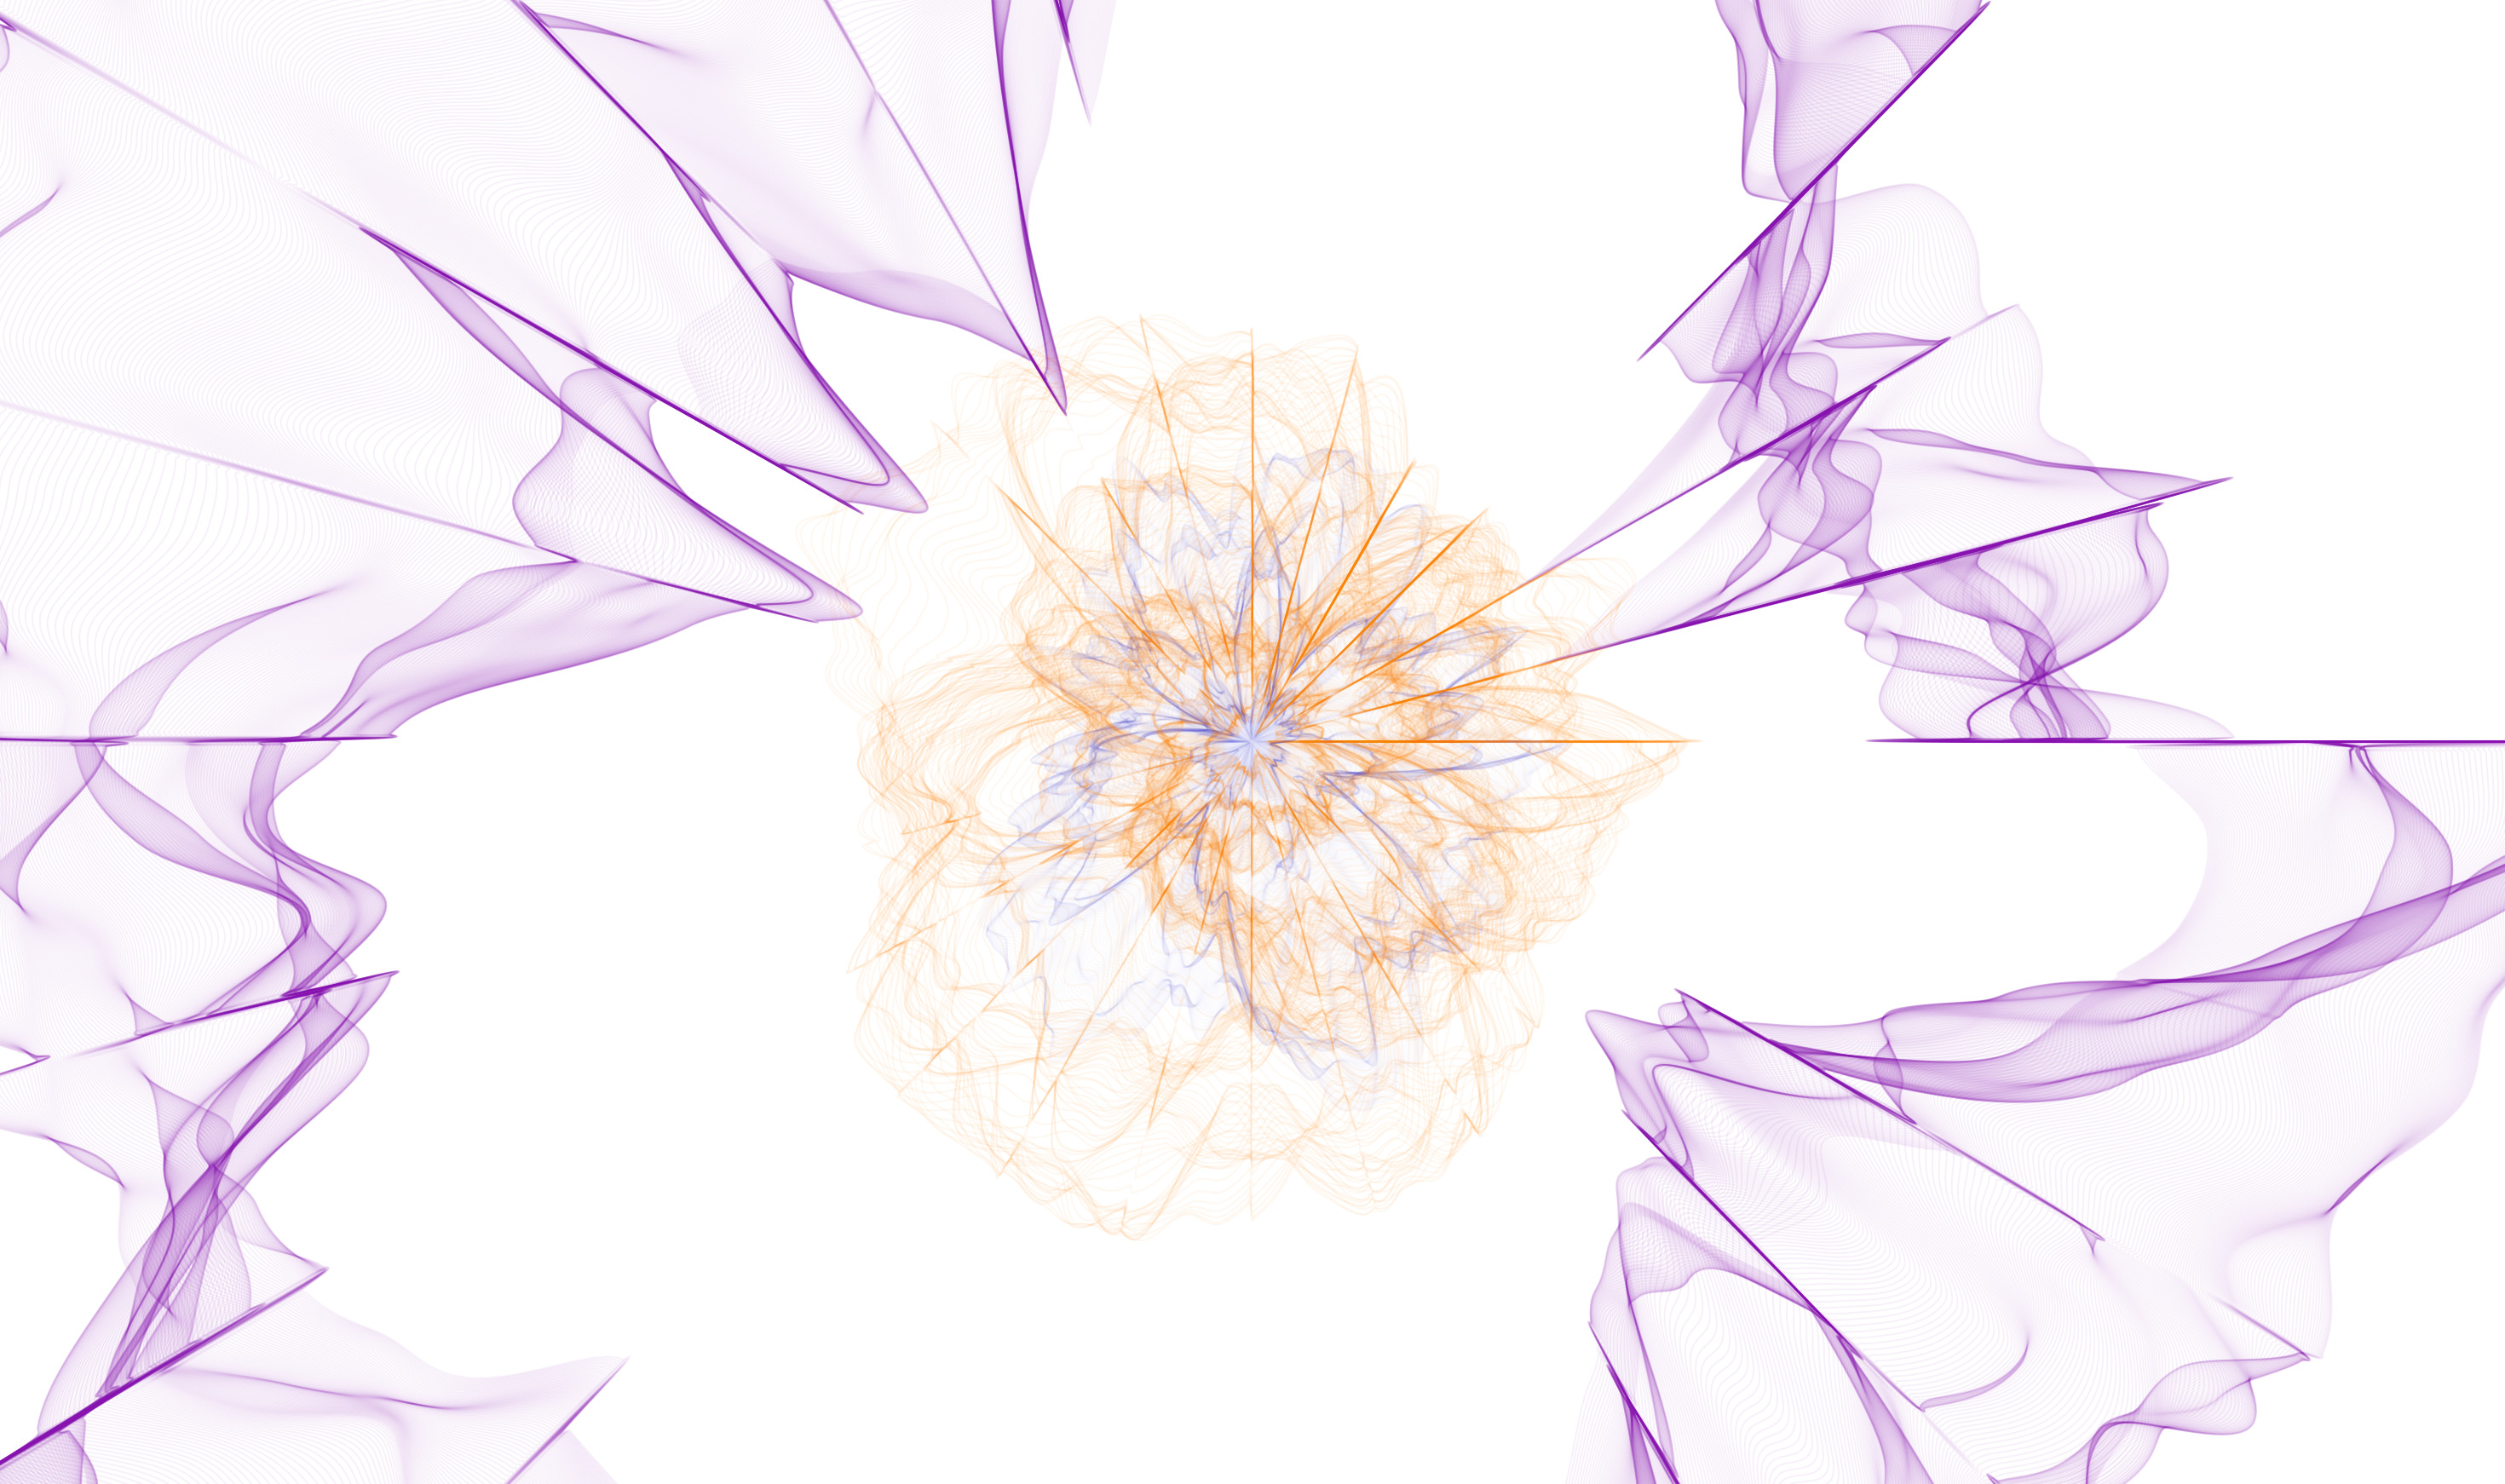
2017
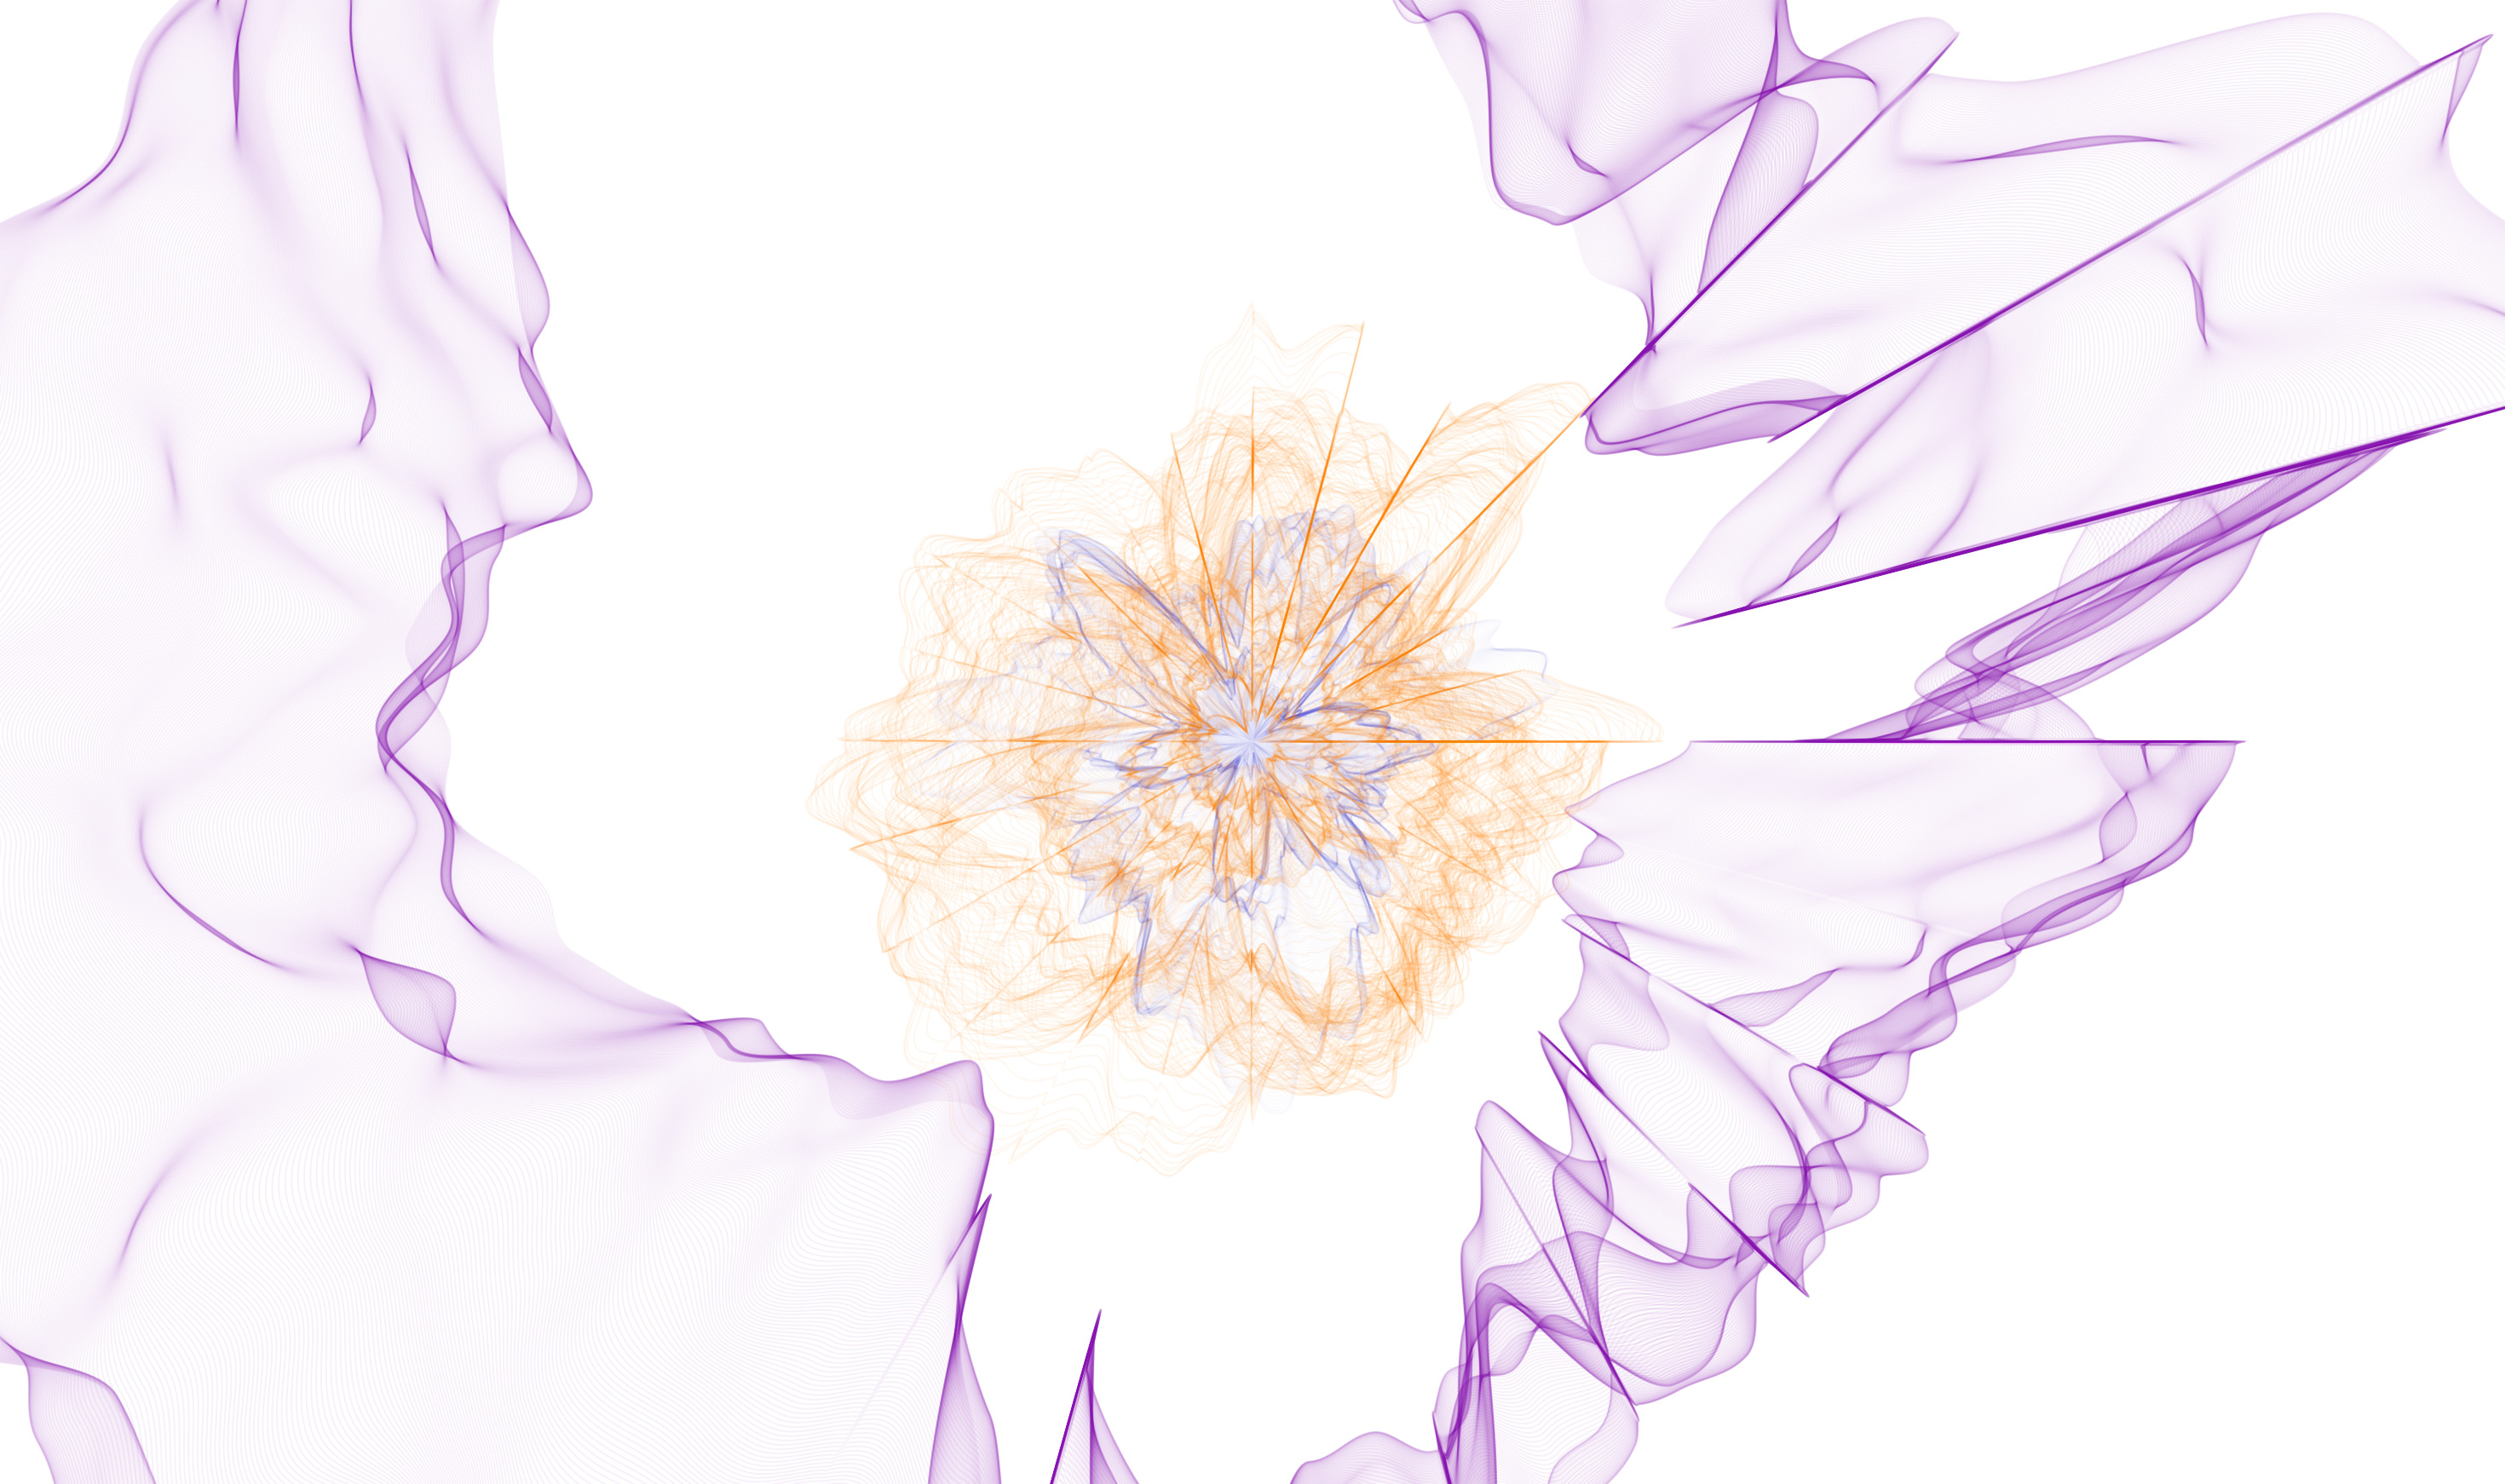
2018
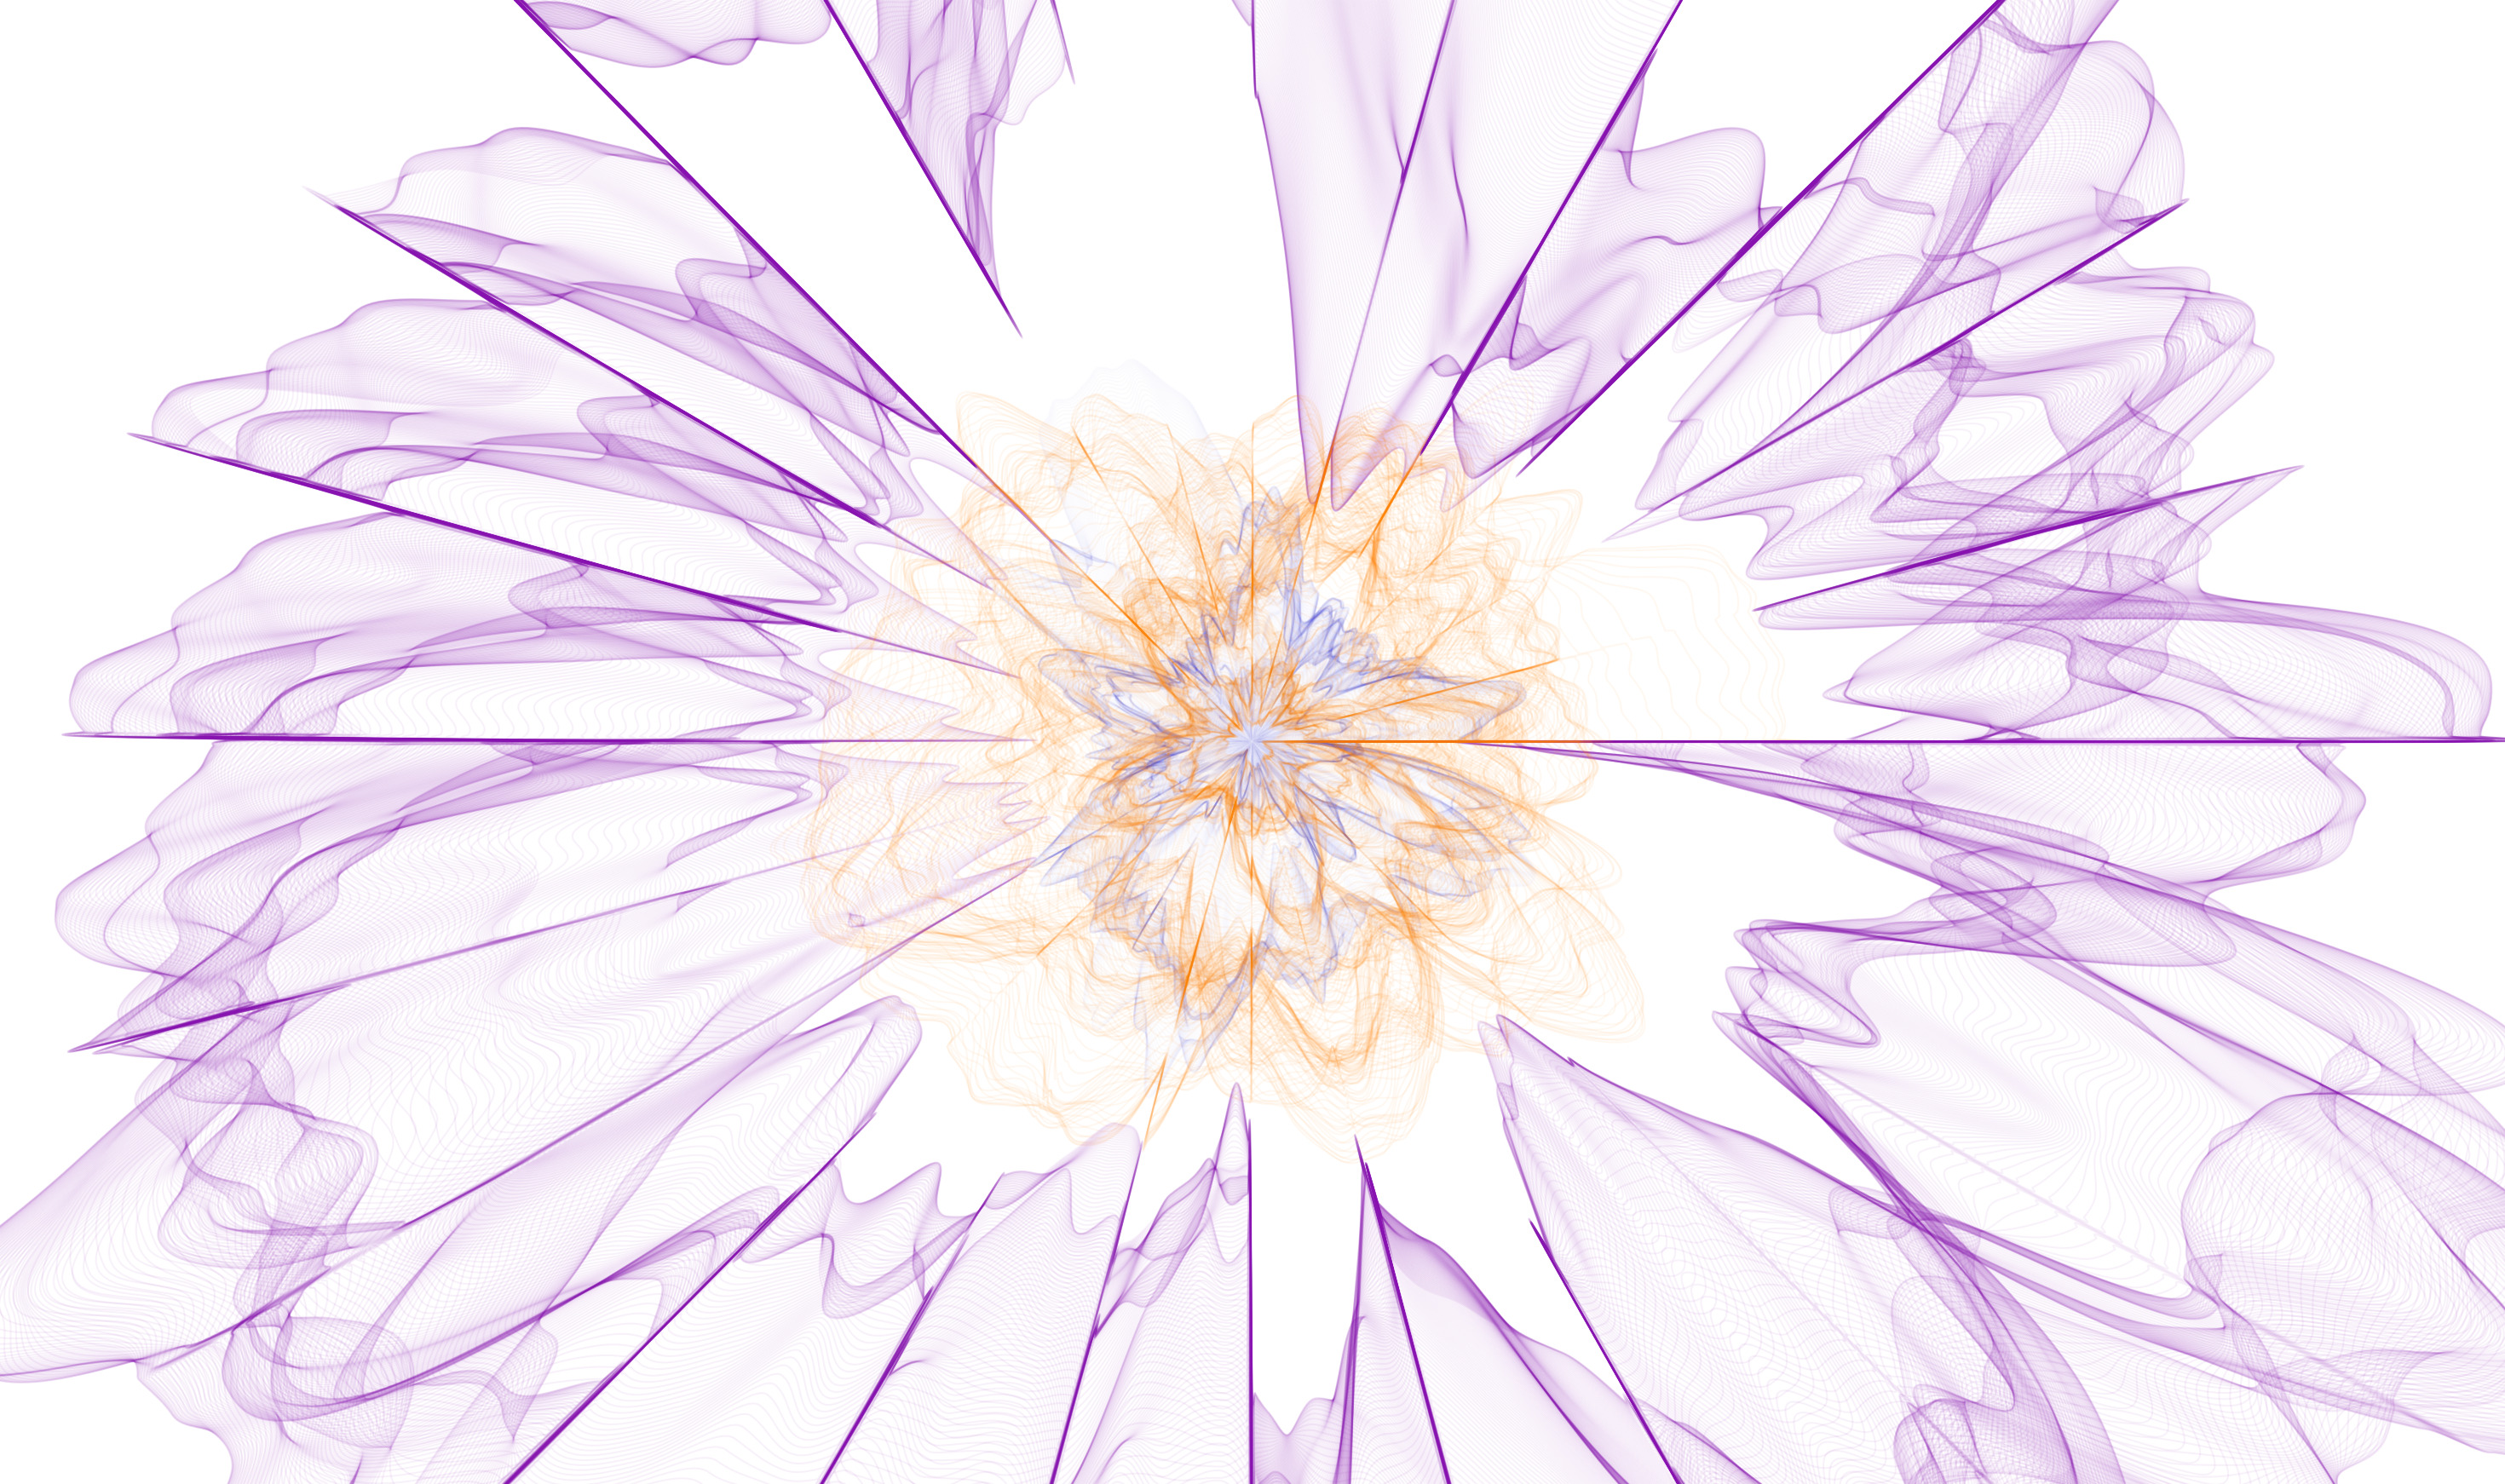
2019
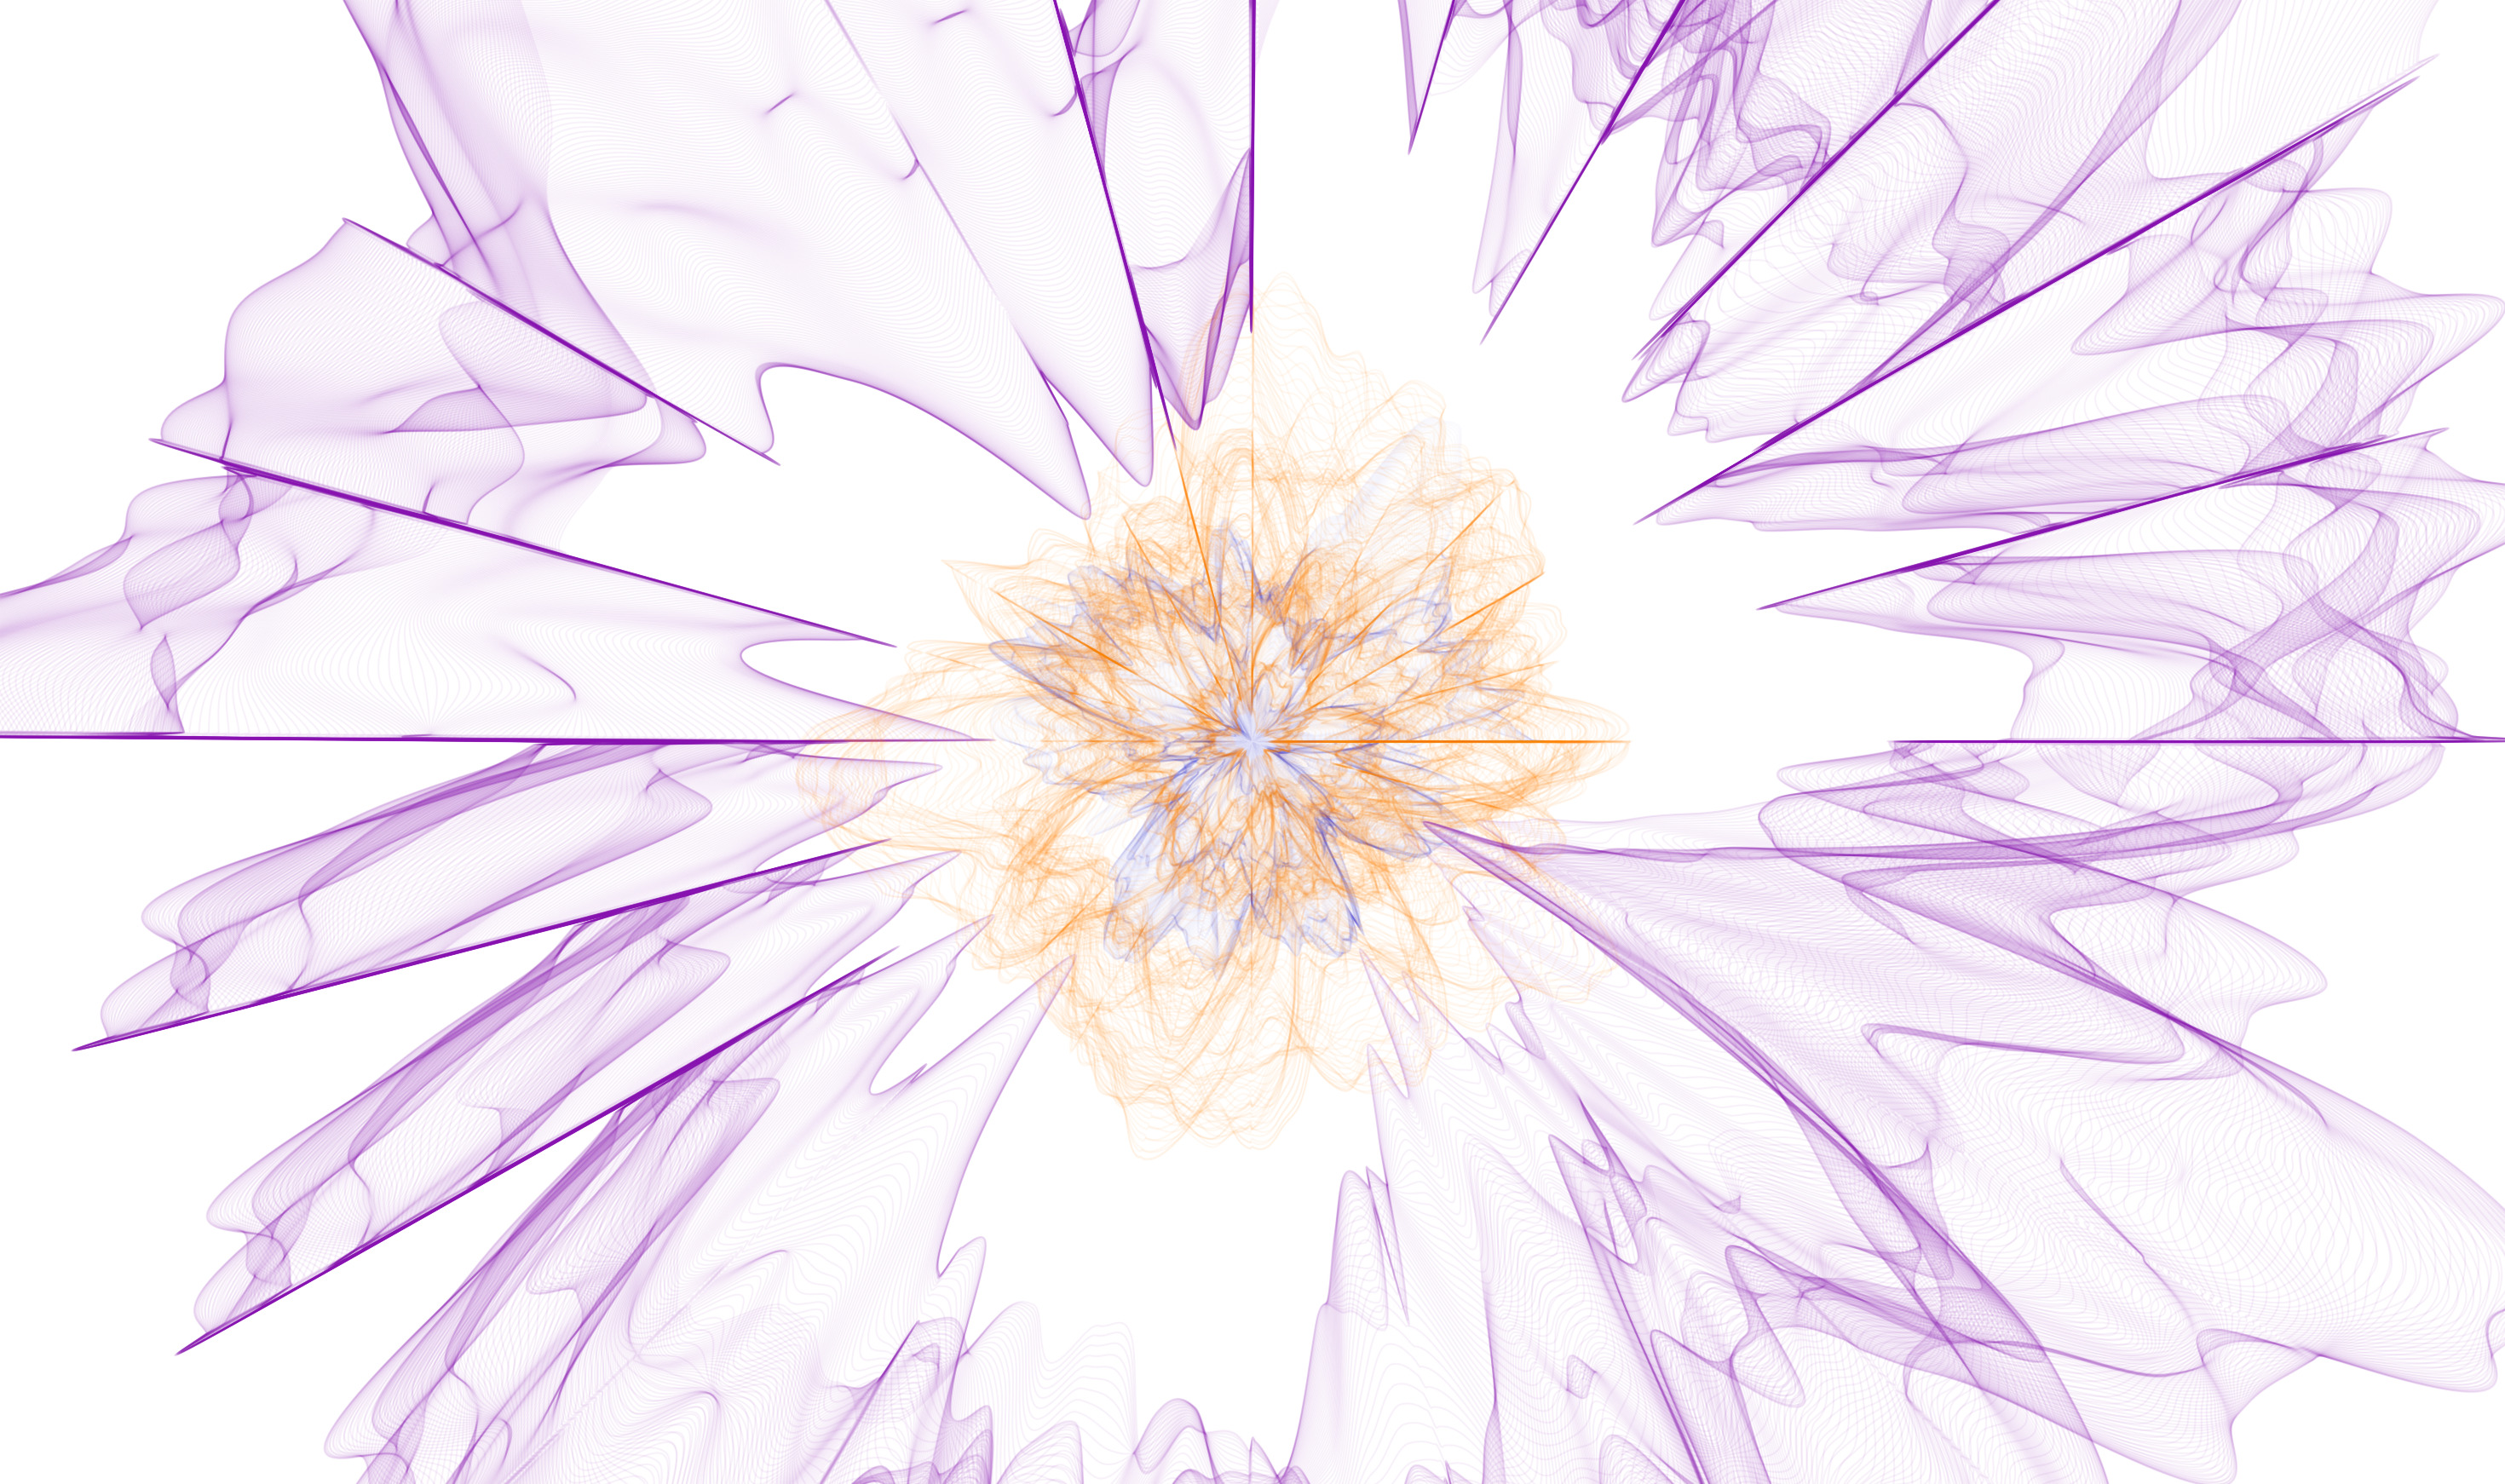
2020
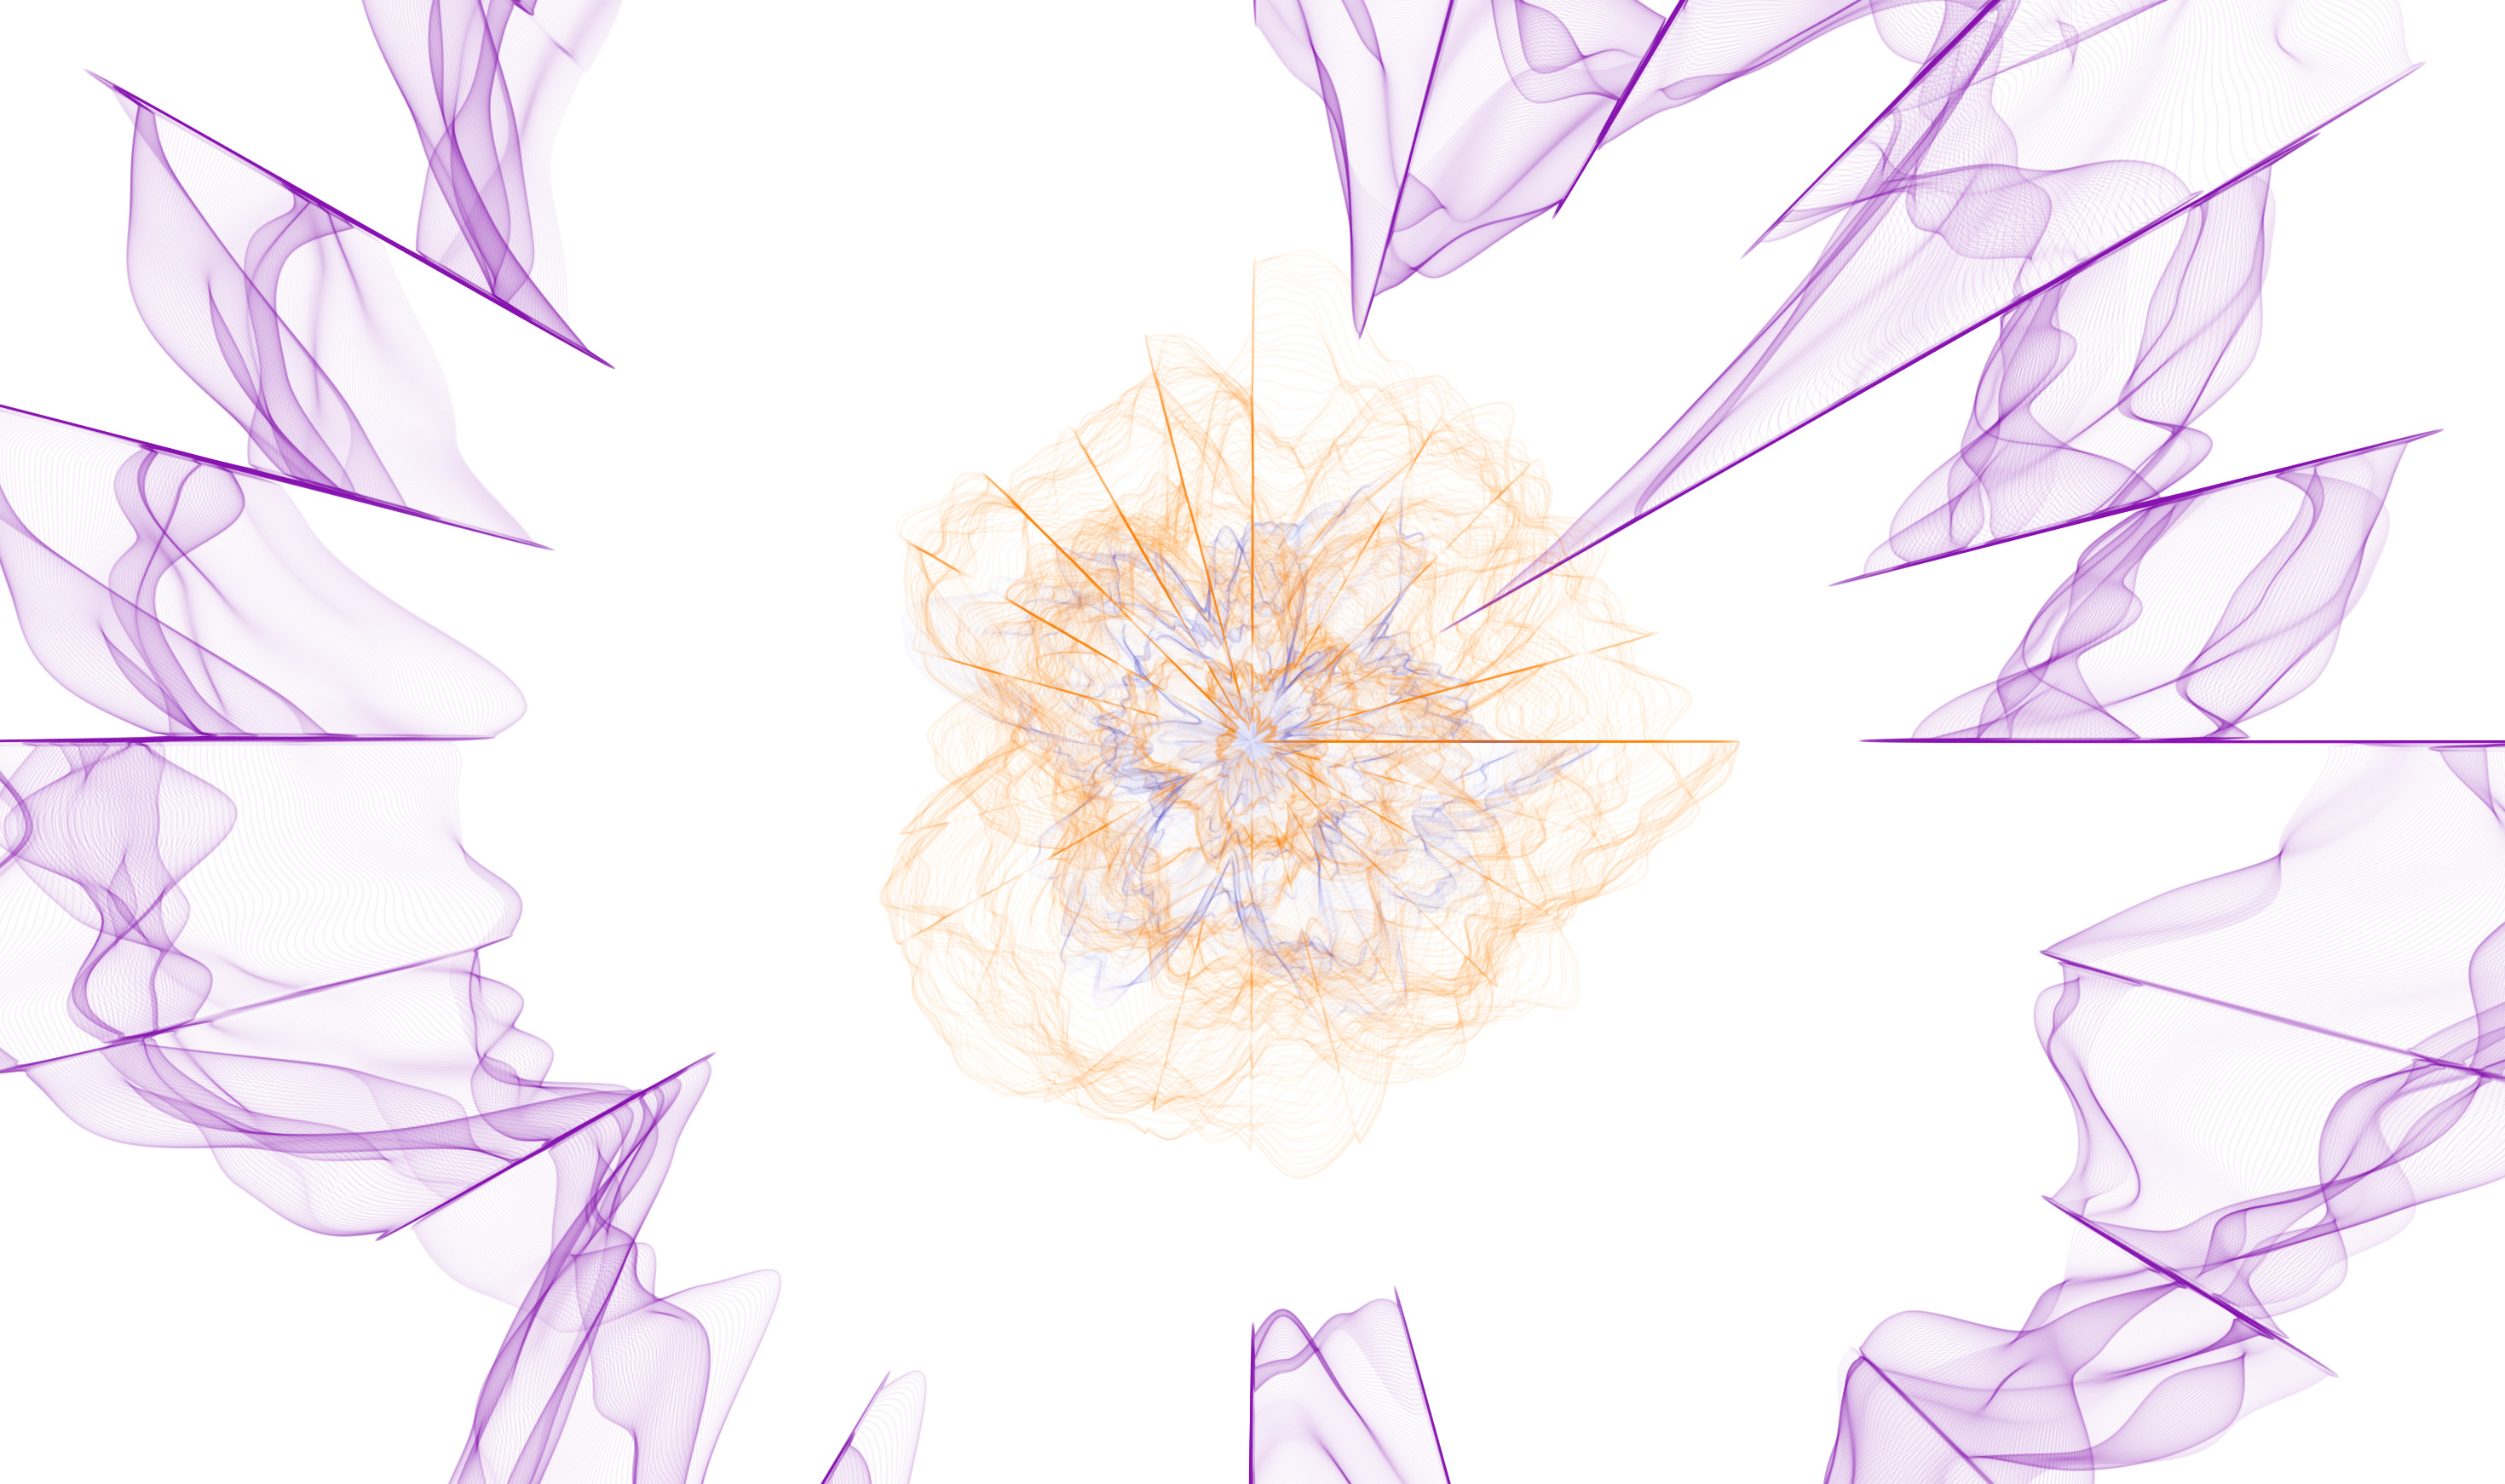
2021
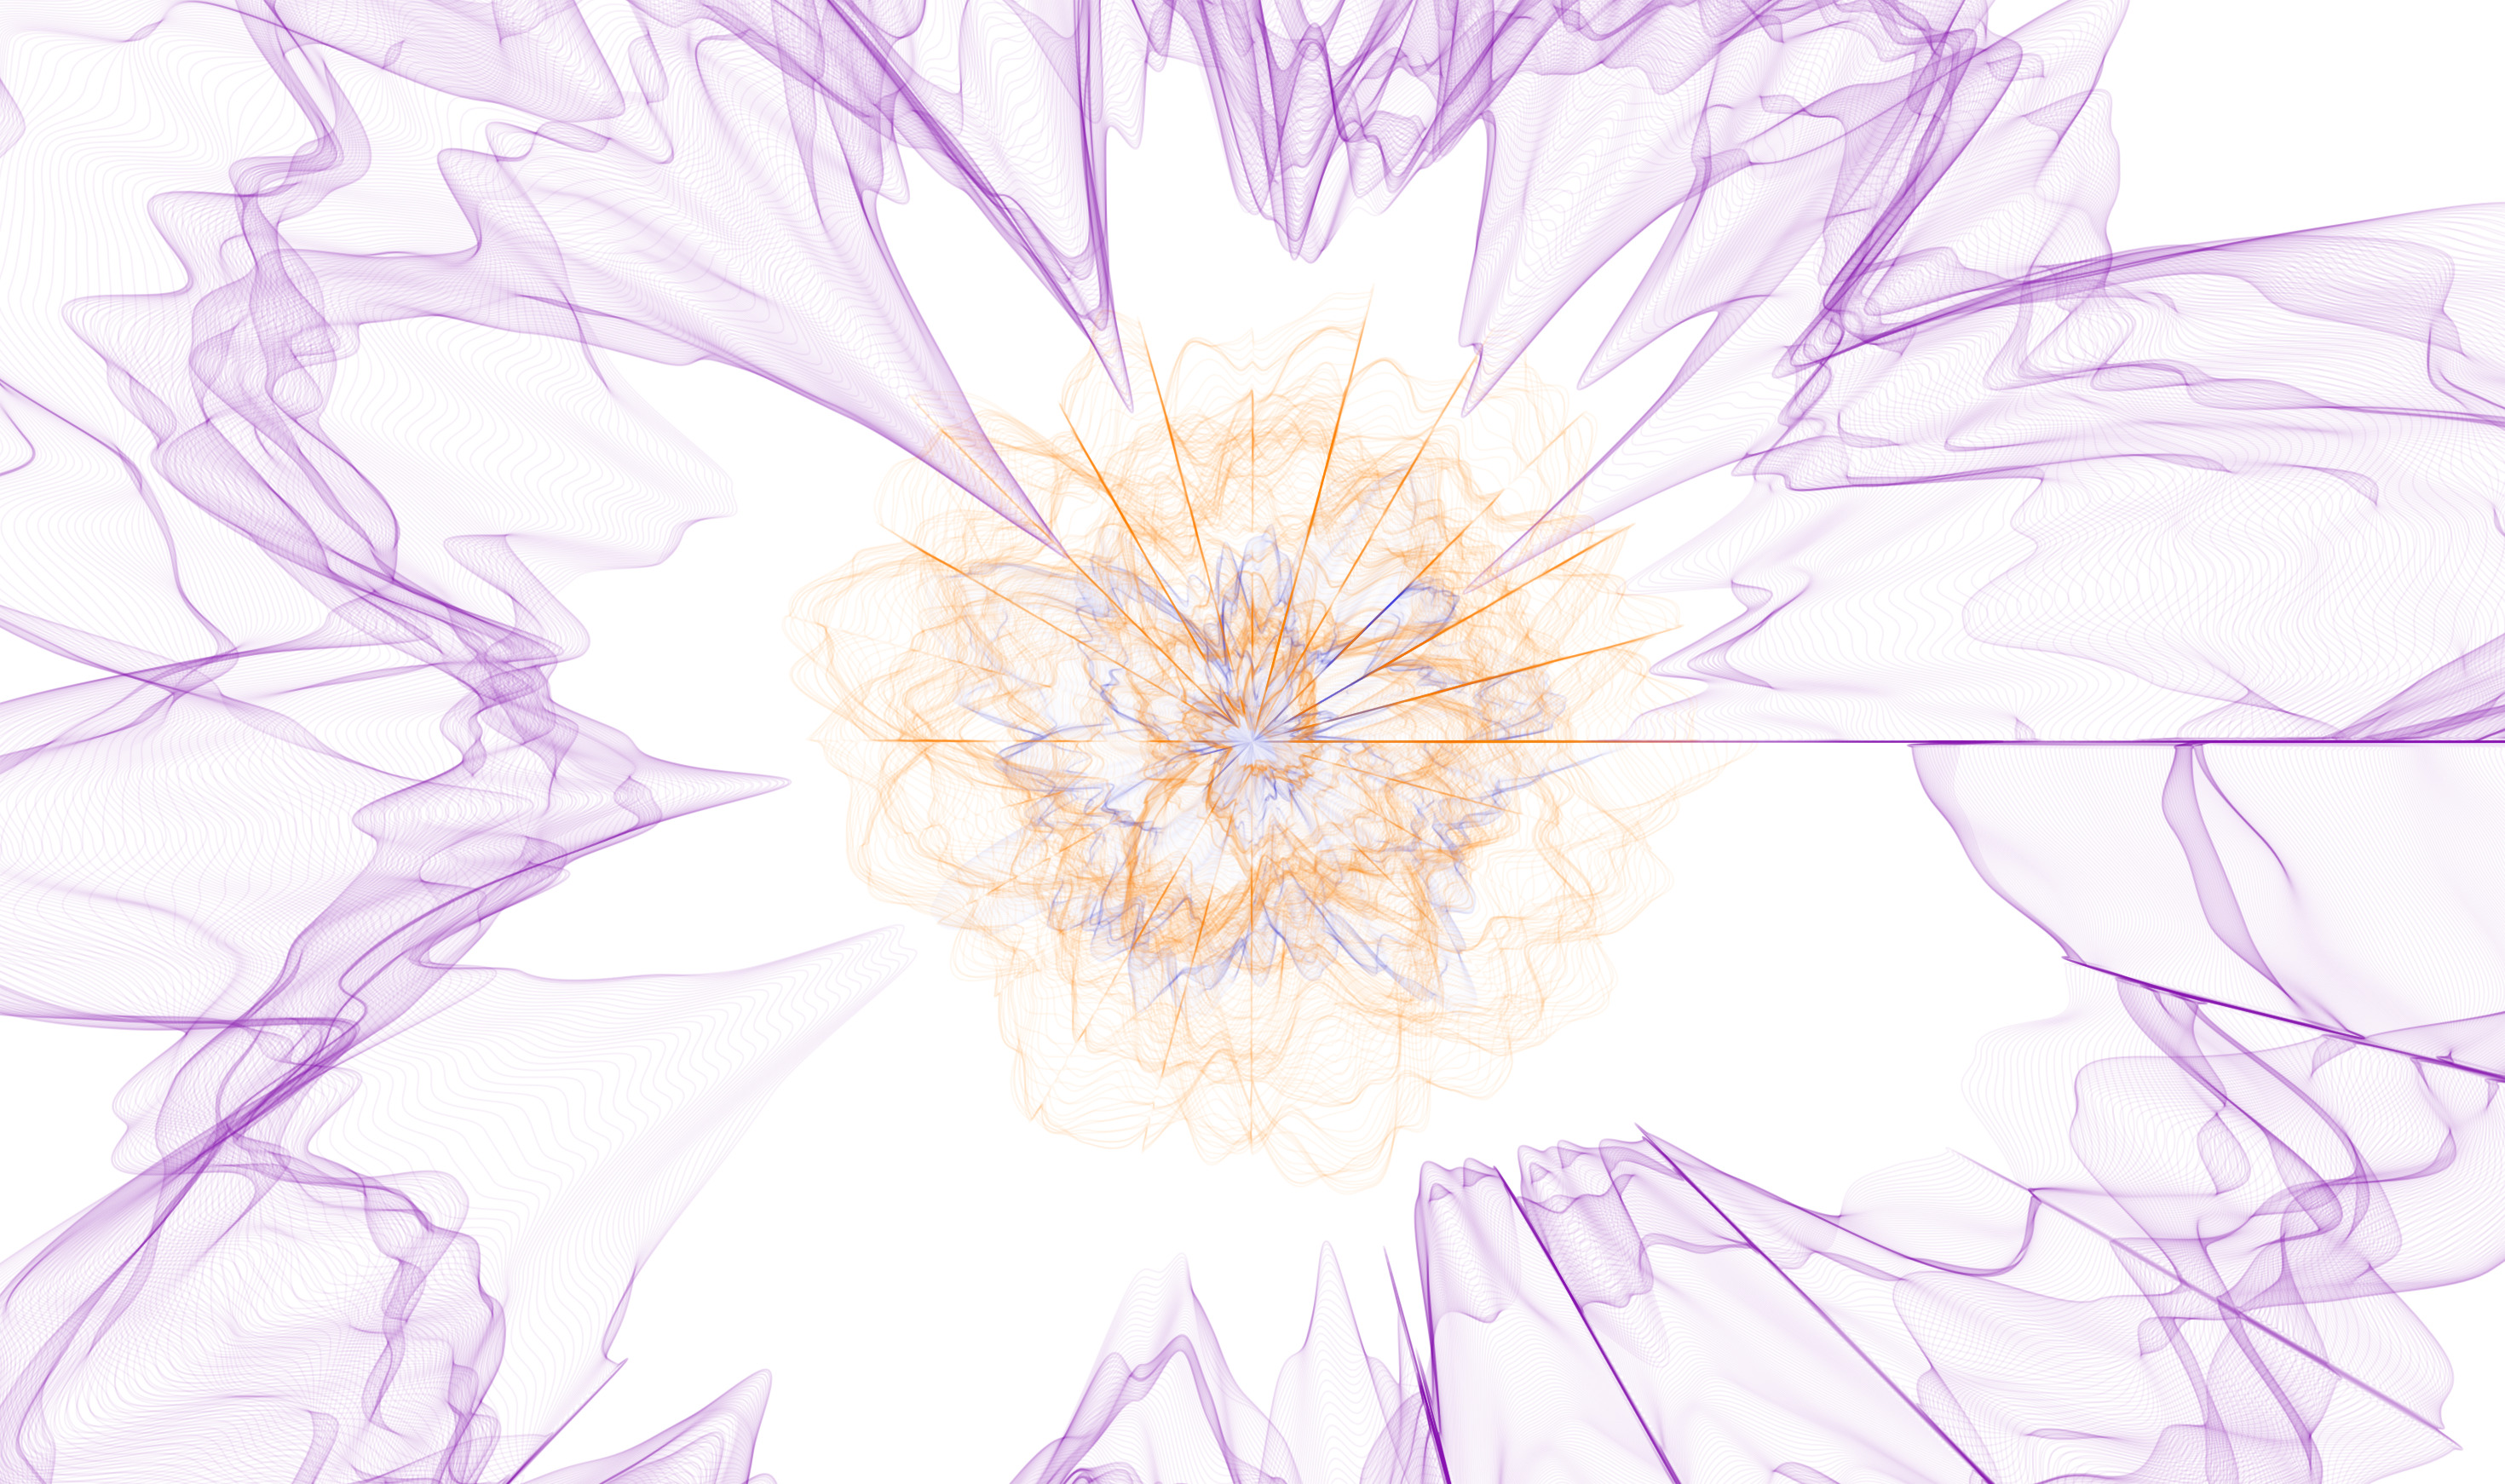
2022
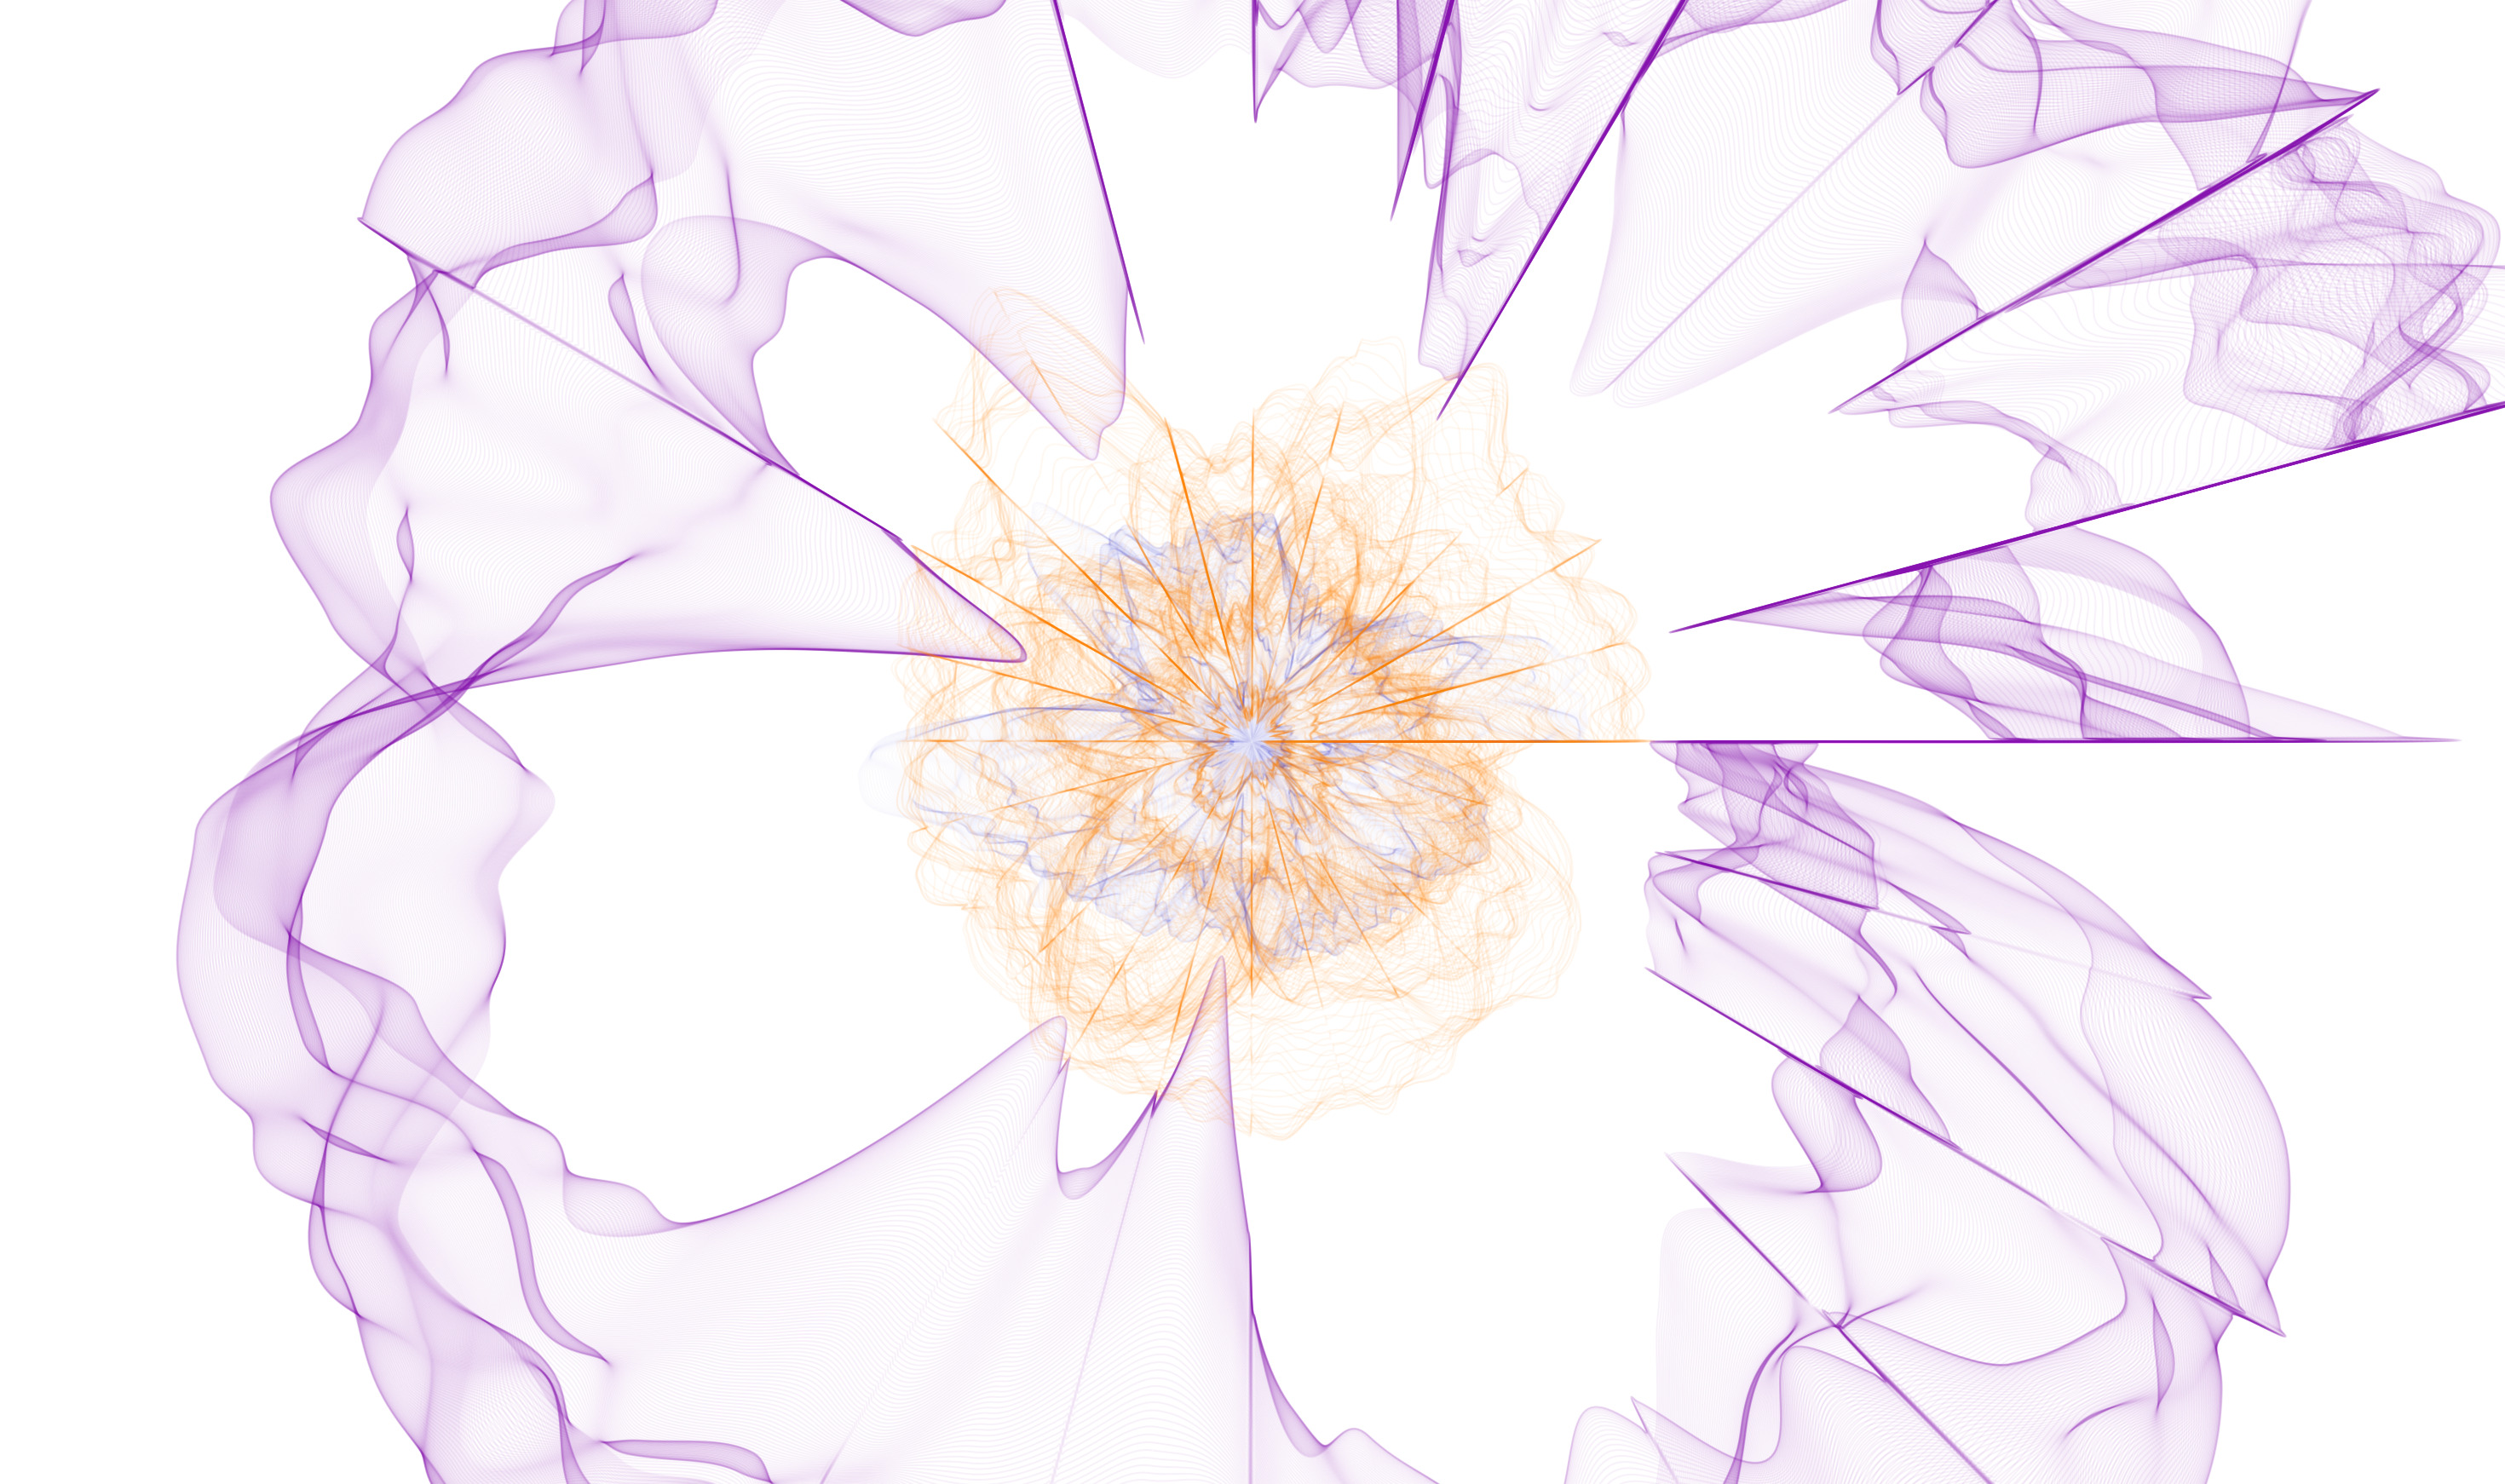
2023
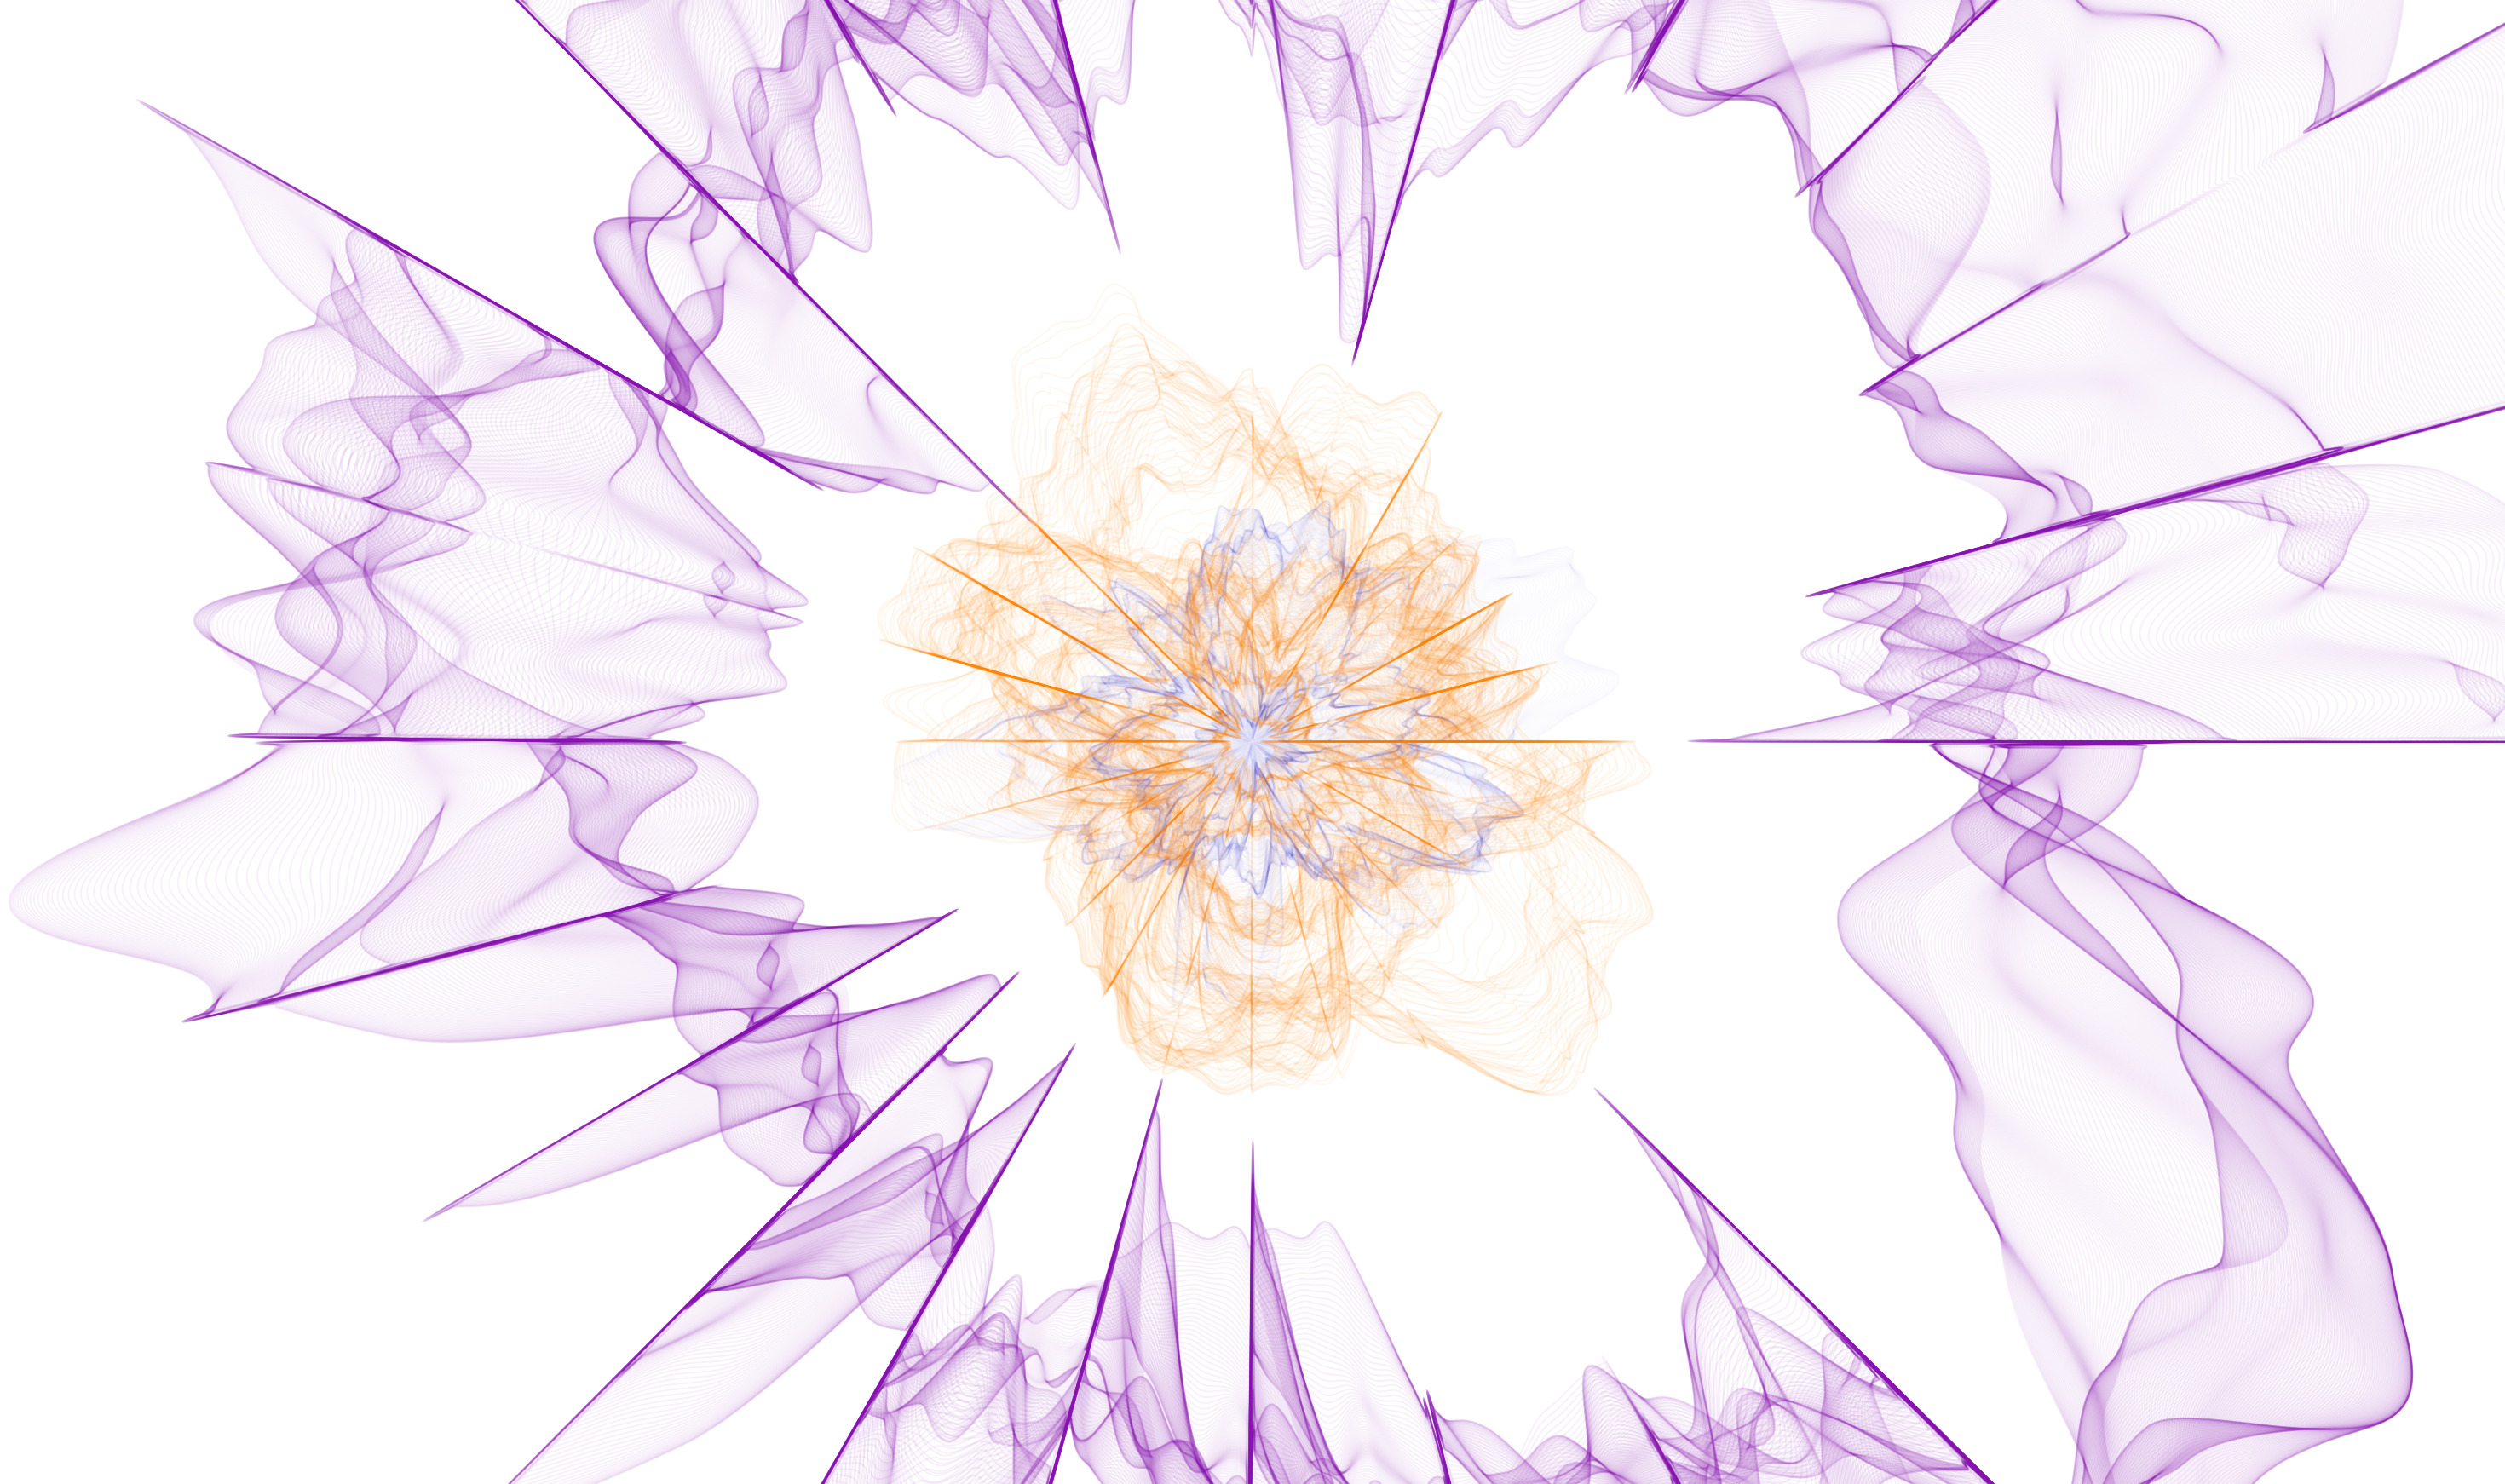
As Posters
Early Iterations
Version 1
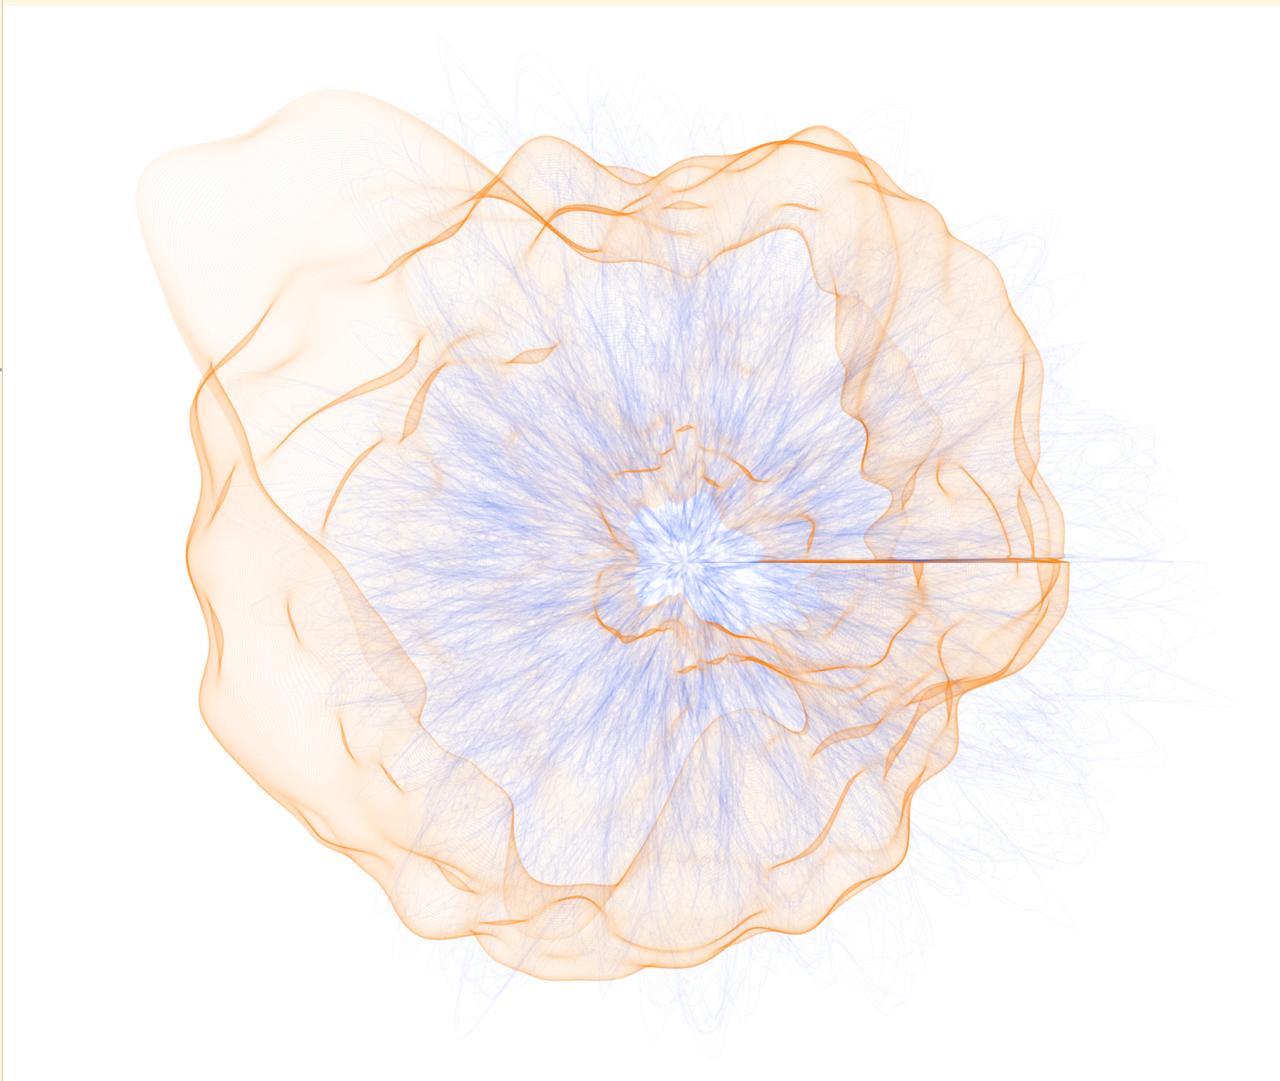
Version 2
